Showing posts with label Intel. Show all posts

Thursday, 26 June 2014

Notes on False Sharing

{This post is part of a long running series on lock free queues, checkout the full index to get more context here}
I've recently given a talk on queues and related optimisations, but due to the limitations of time, the Universe and Everything else had to cut short the deep dive into false sharing. Here however I'm not limited by such worldly concerns, so here is more detail for those who can stomach it.

What mean False Sharing?

Described before on this blog and in many other places (IntelusenixMr. T), but assuming you are not already familiar with the issue:
"false sharing is a performance-degrading usage pattern that can arise in systems with distributed, coherent caches at the size of the smallest resource block managed by the caching mechanism. When a system participant attempts to periodically access data that will never be altered by another party, but that data shares a cache block with data that is altered, the caching protocol may force the first participant to reload the whole unit despite a lack of logical necessity. The caching system is unaware of activity within this block and forces the first participant to bear the caching system overhead required by true shared access of a resource." - From Wikipedia
Makes sense, right?
I tried my hand previously at explaining the phenomena in terms of the underlying coherency protocol which boils down to the same issue. These explanations often leave people still confused and I spent some time trying to reduce the explanation so that the idea can get across in a presentation... I'm pretty sure it still left people confused.
Let's try again.
The simplest explanation I've come up with to date is:
  1. Memory is cached at a granularity of a cache line (assumed 64 bytes, which is typical, in the following examples but may be a smaller or larger power of 2, determined by the hardware you run on)
  2. Both reading and writing to a memory location from a particular CPU require the presence of a copy of the memory location in the reading/writing CPU cache. The required location is 'viewed' or cached at the granularity of a cache line.
  3. When a line is not in a threads cache we experience a cache miss as we go searching for a valid copy of it.
  4. Once a line is in our cache it may get evicted (when more memory is required) or invalidated (because a value in that line was changed by another CPU). Otherwise it just stays there.
  5. A write to a cache line invalidates ALL cached copies of that line for ALL CPUs except the writer.
I think there is a mistaken intuition most of us have when it comes to memory access, which is that we think of it as direct. In reality however you access memory through the CPU cache hierarchy and it is in the attempt to make this system coherent and performant that the hardware undoes our intuition. Rather than thinking of all CPUs accessing a global memory pool we should have a mental model that is closer to a distributed version control system as illustrated in this excellent post on memory barriers.
Given the above setting of the stage we can say that false sharing occurs when Thread 1 invalidates (i.e writes to) a cache line required by Thread2 (for reading/writing) even though Thread2 and Thread1 are not accessing the same location.
The cost of false sharing is therefore observable as cache misses, and the cause of false sharing is the write to the cache line (coupled with the granularity of cache coherency). Ergo, the symptom of false sharing can be observed by looking at hardware events for your process or thread:
  • If you are on linux you can use perf. (Checkout the awesome perf integration in JMH!)
  • On linux/windows/mac Intel machines there is PCM.
  • From Java you can use Overseer
  • ... look for hardware counters on google.
Now assuming you have established that the number of cache misses you experience is excessive, the challenge remains in finding the sources of these cache misses. Sadly for Java there is no free utility that I'm aware of which can easily point you to the source of your false sharing problem, C/C++ developers are spoilt for choice by comparison. Some usual suspects to consider however are any shared data constructs, for example queues.


Active False Sharing: Busy Counters

Lets start with a queue with 2 fields which share the same cache line where each field is being updated by a separate thread. In this example we have an SPSC queue with the following structure:
Ignoring the actual correct implementation and edge cases to make this a working queue (you can read more about how that part works here), we can see that offer will be called by one thread, and poll by another as this is an SPSC queue for delivering messages between 2 threads. Each thread will update a distinct field, but as the fields are all jammed tight together we know False Sharing is bound to follow.
The solution at the time of writing seems to be the introduction of padding by means of class inheritance which is covered in detail here. This will add up to an unattractive class as follows:
Yipppeee! the counters are no longer false sharing! That little Pad in the middle will make them feel all fresh and secure.


Passive False Sharing: Hot Neighbours

But the journey is far from over (stay strong), because in False Sharing you don't have to write to a shared cache line to suffer. In the above example both the producer and the consumer are reading the reference to buffer which is sharing a cache line with naughty Mr. consumerIndex. Every time we update consumerIndex an angel loses her wings! As if the wings business wasn't enough, the write also invalidates the cache line for the producer which is trying to read the buffer so that it can write to the damn thing. The solution?
MORE PADDING!!
Surely now everyone will just get along?

The Object Next Door

So now we have the consumer and the producer feverishly updating their respective indexes and we know the indexes are not interfering with each other or with buffer, but what about the objects allocated before/after our queue object? Imagine we allocate 2 instances of the queue above and they end up next to each other in memory, we'd be practically back to where we started with the consumerIndex on the tail end of one object false sharing with the producer index at the head end of the other. In fact, the conclusion we are approaching here is that rapidly mutated fields make very poor neighbours altogether, be it to other fields in the same class or to neighbouring classes. The solution?
EVEN MORE PADDING!!! 
Seems a tad extreme don't it? But hell, at least now we're safe, right?

Buffers are people too

So we have our queue padded like a new born on it's first trip out the house in winter, but what about Miss buffer? Arrays in Java are objects and as such the buffer field merely point to another object and is not inlined into the queue (as it can be in C/C++ for instance). This means the buffer is also subject to potentially causing or suffering from false sharing. This is particularly true for the length field on the array which will get invalidated by writes into the first few elements of the queue, but equally true for any object allocated before or after the array. For circular array queues we know the producer will go around writing to all the elements and come back to the beginning, so the middle elements will be naturally padded. If the array is small enough and the message passing rate is high enough this can have the same effect as any hot field. Alternatively we might experience an uneven behaviour for the queue as the elements around the edges of the array suffer false sharing while the middle ones don't.
Since we cannot extend the array object and pad it to our needs we can over-allocate the buffer and never use the initial/last slots:
We cannot prevent false sharing between neighbours and the array length, what we can do is hoist it into our own class field and use our copy instead of the buffer field. This can also result in better locality if the hoisted length value is hosted in a field alongside the array itself.
Note that this is costing us some computational overhead to compute the offset index instead of the natural one, but in practice we can implement queues such that the we achieve the same effect with no overhead at all.

Protection against the Elements

While on this topic (I do go on about it... hmmm) we can observe that the producer and the consumer threads can still experience false sharing on the cache line holding adjacent elements in the buffer array. This is something we can perhaps handle more effectively if we had arrays of structs in Java (see the value types JEP and structured arrays proposal), and if the queue was to be a queue of such structs. Reality being the terrible place that it is, this is not the case yet. If we could prove our application indeed suffered from this issue, could we solve it?
Yes, but at a questionable price...
If we allocate extra elements for each reference we mean to store in the queue we can use empty elements to pad the used elements. This will reduce the density of each cache line and as a result the probability of false sharing as less and less elements are in a cache line. This comes a high cost however as we multiply the size of the buffer to make room for the empty slots and actively sabotage the memory throughput as we have less data per read cache line. This is an optimization I am reluctant to straight out recommend as a result, but what the hell? sometimes it might helps.

Playing with Dirty Cards

This last one is a nugget and a half. Usually when people say: "It's a JVM/compiler/OS issue" it turns out that it's a code issue written by those same people. But sometimes it is indeed the machine.
In certain cases you might not be the cause of False Sharing. In some cases you might be experiencing False Sharing induced by card marking. I won't spoil it for you, follow the link.

Summary

So there you have it, 6 different cases of False Sharing encountered in the process of optimizing/proofing the piddly SPSC queue. Each one had an impact, some more easily measured than others. The take away here is not "Pad every object and field to death" as that will be detrimental in most cases, much like making every field volatile. But this is an issue worth keeping in mind when writing shared data structures, and in particular when considering highly contended ones.
We've discussed 2 types of False Sharing:

  • Active: where both threads update distinct locations on the same cache line. This will severely impact both threads as they both experience cache misses and cause repeated invalidation of the cache line.
  • Passive: where one thread writes to and another reads from distinct locations on the same cache line. This will have a major impact on the reading thread with many reads resulting in a cache miss. This will also have an impact on the writer as the cache line sharing overhead is experienced.
These were identified and mitigated in several forms:

  1. Neighbouring hot/hot fields (Active)
  2. Neighbouring hot/cold fields (Passive)
  3. Neighbouring objects (potential for both Active and Passive)
  4. Objects neighbouring an array and the array elements (same as 3, but worth highlighting as a subtlety that arrays are separate objects)
  5. Array elements and array length field (Passive as the length is never mutated)
  6. Distinct elements sharing the same cache line (Passive in above example, but normally Active as consumer nulls out the reference on poll)
  7. -XX:+UseCondCardMark - see Dave Dice article

What should you do?
  1. Consider fields concurrently accessed by different threads, in particular frequently written to fields and their neighbours.
  2. Consider Active AND Passive false sharing.
  3. Consider (and be considerate to) your neighbours.
  4. All padding comes at the cost of using up valuable cache space for isolation. If over used (like in the elements padding) performance can suffer.
And finally: love thy neighbour, just a little bit and with adequate protection and appropriate padding, but still love'em.
Belgium! Belgium! Belgium! Belgium! Belgium! Belgium! Belgium! Belgium! Belgium! Belgium! Belgium!

Sunday, 15 September 2013

Diving Deeper into Cache Coherency

I recently gave a talk about Mechnical Sympathy at Facebook, which was mostly a look at the topic through the SPSC queue optimization series of posts. During the talk I presented the optimisation step (taken in Martin's original series of queue implementations) of adding a cache field for the head and tail. Moving from this:

To this:


This change yields a great improvement in throughput which I explained to be down to the reduction in coherency traffic between the cores. This is:
  1. Not what I stated previously here.
  2. A very brief and unsatisfying explanation.
I shall try and remedy that in this post.


Penance

In my original step by step post I explained the benefit of the above optimization is the replacement of a volatile read with a plain read. Martin was kind enough to gently correct me in the comments:
"The "volatile read" is not so much the issue. The real issues come from the read of the head or tail from the opposite end will pretty much always result in a cache miss. This is because the other side is constantly changing it."
and I argued back, stating the JIT compiler can hoist the field into a register and wistfully wishing I could come up with an experiment to prove one way or the other.  I was mostly wrong and Martin was totally right. 
I say mostly and not entirely because eliminating volatile reads is not a bad optimization and is responsible for part of the perf improvement. But it is not the lion share. To prove this point I have hacked the original version to introduce volatile reads (but still plain writes) from the headCache/tailCache fields. I won't bore you with the code, it's using the field offset and Unsafe.getLongVolatile to do it.
I ran the test cross core for 30 times and averaged the summary results. Running on new hardware (so no reference point to prev. quoted results) i7-4700MQ/Ubuntu 13.04/JDK7u25. Here are the results, comparing Original21 (head/tail padded, no cache fields), Original3 (head/tail padded, head/tailCache padded) and VolatileRead (same as Original3, but with volatile read of cache fields):

Original21:     65M ops/sec
Original3:     215M ops/sec
VolatileRead:  198M ops/sec

As we can see, there is no massive difference between Original3 and VolatileRead (especially when considering the difference from Original21), leading me to accept I need to buy Martin a beer, and apologize to any reader of this blog who got the wrong idea reading my post.
Exercise to the reader: I was going to run the above with perf to quantify the impact on cache-misses, but as perf doesn't support this functionality on Haswell I had to let it go. If someone cares to go through the exercise and post a comment it would be most welcome.


What mean cache coherency?

Moving right along, now that we accept the volatile read reduction is not the significant optimization here, let us dig deeper into this cache coherency traffic business. I'll avoid repeating what is well covered elsewhere (like cache-coherence, or MESIF on wikipedia, or this paper, some excellent examples here, and an animation for windows users only here) and summarize:
MESI State Diagram
  • Modern CPUs employ a set of caches to improve memory access latency.
  • To present us with a consistent view of the world when concurrent access to memory happens the caches must communicate to give us a coherent state.
  • There are variations on the protocol used. MESI is the basic one. Recent intels use MESIF. In the examples below I use MESI as the added state in MESIF adds nothing to the use case.
  • The guarantee they go for is basic:
    • One change at a time (to a cache line): A line is never in M state in more than one place. 
    • Let me know if I need a new copy: If I have a copy and someone else changed it I need to get me a new copy. (My copy will move from Shared to Invalid)
All of this happens under the hood of your CPU without you needing to lose any sleep, but if we somehow cause massive amounts of cache coherency traffic then our performance will suffer. One note about the state diagram. The observant reader (thanks Darach) will notice the I to E transition for Processor Write(PW) is in red. This is not my diagram, but I think the reason behind it is that the transition is very far from trivial (or a right pain in the arse really) as demonstrated below.


False Sharing (once more)

False sharing is a manifestation of this issue where 2 threads are competing to write to the same cache line which is constantly Invalid in their own cache.

Here's a blow by blow account of false sharing in terms of cache coherency traffic:
  1. Thread1 and Thread2 both have the false Shared cache line in their cache
  2. Thread1 modifies HEAD (state goes from S to E), Thread2's copy is now Invalid
  3. Thread2 wants to modify TAIL but his cache line is now in state I, so experiences a write miss:
    1. Issue a Read With Intent To Modify (RWITM)
    2. RWITM intercepted by Thread1
    3. Thread1 Invalidates own copy
    4. Thread1 writes line to memory
    5. Thread2 re-issues RWITM which results in read from memory (or next layer cache)
  4. Thread1 wants to write to HEAD :( same song and dance again, the above gets in it's way etc.

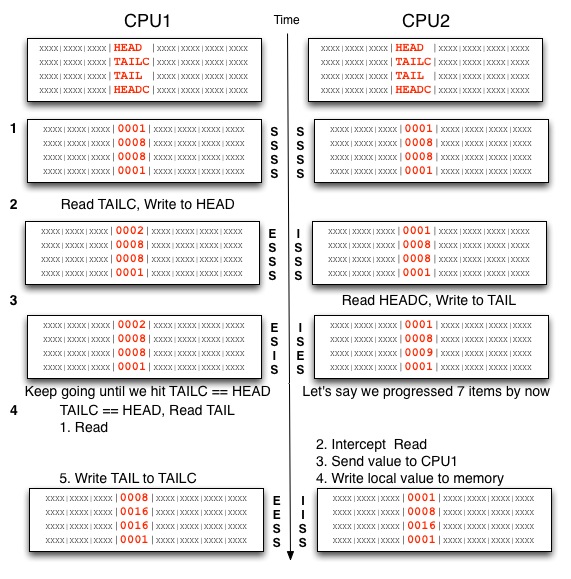
The diagram to the right is mine, note the numbers on the left track the explanation and the idea was to show the cache lines as they mutate on a timeline. Hope it helps :-).


Reducing Read Misses

So False Sharing is really bad, but this is not about False Sharing (for a change). The principal is similar though. With False Sharing we get Write/Read misses, the above manoeuvre is about eliminating Read misses. This is what happens without the HEADC/TAILC fields (C for cache):
  1. Thread1 and Thread2 both have the HEAD/TAIL  cache lines in Shared state in their cache
  2. Thread1 modifies HEAD (state goes from S to E), Thread2's copy is now Invalid
  3. Thread2 wants to read HEAD to check if the queue wrapped, experiences a Read Miss:
    1. Thread2 issues a request for the HEAD cache line
    2. Read is picked up by Thread1
    3. Thread1 delivers the HEAD cache line to Thread2, the request to memory is dropped
    4. The cache line is written out to main memory and now Thread1/2 have the line in Shared state
This is not as bad as before, but is still far from ideal. The thing is we don't need the latest value of HEAD/TAIL to make progress, it's enough to know that the next increment to our counter is available to be used. So in this use case, caching the head/tail gives us a great win by avoiding all of these Read Misses, we only hit the Read Miss when we run out of progress to be made against our cached values. This looks very different:
  1. Thread1 and Thread2 both have the HEAD/TAIL/HEADC/TAILC  cache lines in Shared state in their cache (the TAILC is only in Thread1, HEADC is only in Thread2, but for symmetry they are included).
  2. Thread1 reads TAILC and modifies HEAD (state goes from S to E), Thread2's copy is now Invalid.
  3. Thread2 reads from HEADC which is not changed. If TAIL is less than HEADC we can make progress (offer elements) with no further delay. This continues until TAIL is equal to HEADC. As long as this is the case HEAD is not read, leaving it in state M in Thread1's cache. Similarly TAIL is kept in state M and Thread2 can make progress. This is when we get the great performance boost as the threads stay out of each others way.
  4. Thread1 now needs to read TAIL to check if the queue wrapped, experiences a Read Miss:
    1. Thread1 issues a request for the TAIL cache line
    2. Request is picked up by Thread2
    3. Thread2 delivers the TAIL cache line to Thread1, the request to memory is dropped
    4. The cache line is written out to main memory and now Thread1/2 have the line in Shared state
    5. TAIL is written to TAILC (TAILC line is now E)
The important thing is that we spend most of our time not needing the latest HEAD value which means Thread2 is not experiencing as many Read Misses, with the added benefit of the threads not having to go back and forth from Shared to Exclusive/Modified state on writes. Once I have a line in the M state I can just keep modifying with no need for any coherence traffic. Also note we never experience a Write Miss.


Summary

In an ideal application (from a cache coherency performance POV) threads never/rarely hit a read or write miss. This translates to having single writers to any piece of data, and minimizing reads to any external data which may be rapidly changing. When we are able to achieve this state we are truly bound by our CPU (rather than memory access).
The takeaway here is: Fast moving data should be in M state as much as possible. A read/write miss by any other thread competing for that line will lead to reverting to S/I which can have significant performance implications. The above example demonstrates how this can achieved by caching stale but usable copies locally to another thread.

Tuesday, 6 August 2013

JMM Cookbook Footnote: NOOP Memory Barriers on x86 are NOT FREE

In Doug Lea's excellent JMM Cookbook the following observation is made about memory barriers on different architectures:
Processor LoadStore LoadLoad StoreStore StoreLoad Data
dependency
orders loads?
Atomic
Conditional
Other
Atomics
Atomics
provide
barrier?
sparc-TSO no-op no-op no-op membar (StoreLoad) yes CAS: casa swap,ldstub full
x86 no-op no-op no-op mfence or
cpuid or
locked insn
yes CAS:
cmpxchg
xchg,
locked insn
full
ia64 combine
with

st.rel or
ld.acq
ld.acq st.rel mf yes CAS:
cmpxchg
xchg,
fetchadd
target +
acq/rel
arm dmb
(see below)
dmb
(see below)
dmb-st dmb indirection
only
LL/SC:
ldrex/strex

target
only
This leads quite a few people to conclude that there is no performance cost to the memory barriers that are marked no-op, and on occasion leads people to believe they can just not put them in at all. After all, what is the point in a no-op? surely a program with the no-ops removed is the same program, right? Wrong...
After having this debate again recently I thought I'd document it here to avoid repetition, and to get some second opinions I got some help from the good people on the concurrency-interest mailing list.

What's a Memory Barrier?

This is Noop
From the Cookbook:
"Compilers and processors must both obey reordering rules. No particular effort is required to ensure that uniprocessors maintain proper ordering, since they all guarantee "as-if-sequential" consistency. But on multiprocessors, guaranteeing conformance often requires emitting barrier instructions...
...Memory barrier instructions directly control only the interaction of a CPU with its cache, with its write-buffer that holds stores waiting to be flushed to memory, and/or its buffer of waiting loads or speculatively executed instructions."
We need memory barriers to help the compiler and CPU make sense of our intentions in terms of concurrency. We need to hold them back from optimizing away code that can be eliminated or re-ordered if optimal single threaded execution is the only consideration. The last bit suggests that barriers are really about memory ordering.

Why isn't it free?

Volatile reads (LoadLoad) and lazySet/putOrdered (StoreStore) are both "No-op"s on x86. Mike Barker (LMAX dude, maintainer and contributor to the Disruptor, here's his blog) replied to my request for clarification:
"The place to look (as definitive as it gets for the hardware) is section 8.2.2, volume 3A of the Intel programmer manual.  It lists the rules that are applied regarding the reordering of instructions under the X86 memory model.  I've summarised the relevant ones here:
- Reads are not reordered with other reads.
- Writes are not reordered with older reads.
- Writes to memory are not reordered with other writes.
- Reads may be reordered with older writes to different locations but not with older writes to the same location.
The only reordering that will occur with x86 is allowing reads to be executed before writes (to other locations), hence the need for a LOCKed instruction to enforce the store/load barrier.  As you can see with the above rules, store are not reordered with older stores and loads are not reordered with older loads so a series of MOV instructions is sufficient for a store/store or a load/load barrier."
So since a volatile read and a lazySet both boil down to a MOV from/to memory, no further special instruction is required (hence no-op) as the underlying architecture memory model obeys the rules required by the JMM (Note: lazySet is not in the JMM, but is as good as in it, I go into the origins of lazySet here). But while that does mean these barriers are cheap it doesn't make them free. The above rules Mike is quoting are for the generated assembly, but the barriers impact the compiler as well. Memory barriers are there to stop your code being interpreted a particular way by both the compiler and the CPU. The JMM guarantees that memory barriers are respected by BOTH. This is important because the JMM Cookbook is talking about CPU no-ops, not compiler no-ops. Vitaly Davidovich from concurrency interest replied:
"Yes, volatile loads and lazySet do not cause any cpu fence/barrier instructions to be generated - in that sense, they're noop at the hardware level.  However, they are also compiler barriers, which is where the "cheap but ain't free" phrase may apply. The compiler cannot reorder these instructions in ways that violate their documented/spec'd memory ordering effects. So for example, a plain store followed by lazySet cannot actually be moved after the lazySet; whereas if you have two plain stores, the compiler can technically reorder them as it sees fit (if we look at just them two and disregard other surrounding code). So, it may happen that compiler cannot do certain code motion/optimizations due to these compiler fences and therefore you have some penalty vs using plain load and stores.  For volatile loads, compiler cannot enregister the value like it would with plain load, but even this may not have noticeable perf diff if the data is in L1 dcache, for example."
The difference in performance between using a plain write and a lazySet has been demonstrated in this post if you look at the difference between the putOrdered and plain writes versions. I expect this difference is far more pronounced in a benchmark than in a full blown system, but the point is it's a demonstrable difference. Similarly here Mr. Brooker demonstrates there is a difference between normal reads and volatile reads. There's a flaw in the experiment in that the volatile writes are making the volatile reads slower, but his point is valid as a demonstration of inhibited optimization (loop is not unrolled, value is not enregistered) and the uncontended read tells that story well.

So... I can't just drop it out of my program?

The TSO model for x86 dictates how your code will behave, if you were writing assembly. If you are writing Java, you are at the mercy of the JIT compiler first, and only then the CPU. If you fail to inform the compiler about your intentions, your instructions may never hit the CPU, or may get there out of order. Your contract is with the JMM first.
It's like punctuation: "helping your uncle Jack off a horse" != "helping your uncle jack off a horse" => punctuation is not a no-op ;-)

Sunday, 6 January 2013

Direct Memory Alignment in Java

Summary: First in a quick(hopefully) series of posts on memory alignment in Java. This post introduces memory alignment, shows how to get memory aligned blocks, and offers an experiment and some results concerning unaligned memory performance.

Since the first days of Java, one of the things you normally didn't need to worry about was memory. This was a good thing for all involved who cared little if some extra memory was used, where it was allocated and when will it be collected. It's one of the great things about Java really. On occasion however we do require a block of memory. A common cause for that is for doing IO, but more recently it has been used as a means to having off-heap memory which allows some great performance benefits to the right use case. Even more recently there has been talk of bringing back C-style structs to Java, to give programmers better control over memory layout. Having stayed away from direct memory manipulation for long(or having never had to deal with it) you may want to have a read of the most excellent series of articles "What Every Programmer Should Know About Memory" by Ulrich Drepper. I'll try and cover the required material as I go along.


Getting it straight

Memory alignment is mostly invisible to us when using Java, so you can be forgiven for scratching you head. Going back to basic definitions here:
"A memory address a, is said to be n-byte aligned when n is a power of two and a is a multiple of n bytes.
A memory access is said to be aligned when the datum being accessed is n bytes long and the datum address is n-byte aligned. When a memory access is not aligned, it is said to be misaligned. Note that by definition byte memory accesses are always aligned."
In other words for n  which is a power of 2:
boolean nAligned = (address%n) == 0;
Memory alignments of consequence are:
  1. Type alignment(1,2,4,8) - Certain CPUs require aligned access to memory and as such would get upset(atomicity loss) if you attempt misaligned access to your data. E.g. if you try to MOV a long to/from an address which is not 8-aligned.
  2. Cache line alignment(normally 64, can be 32/128/other) - The cache line is the atomic unit of transport between the main memory and the different CPU caches. As such packing relevant data to that alignment and to that punctuation can make a difference to your memory access performance. Other considerations are required here due to the rules of interaction between the CPU and the cache lines(false sharing, word tearing, atomicity)
  3. Page size alignment(normally 4096, can be configured by OS) - A page is the smallest chunk of memory transferable to an IO device. As such aligning your data to page size, and using the page size as your allocation unit can make a difference to interactions when writing to disk/network devices.
Memory allocated in the form of objects (anything produced by 'new') and primitives is always type aligned and I will not be looking much into it. If you want to know more about what the Java compiler make of you objects, this excellent blog post should help.
As the title suggests I am more concerned with direct memory alignment. There are several ways to get direct memory access in Java, they boil down to 2 methods:
  1. JNI libraries managing memory --> not worried about those for the moment
  2. Direct/MappedByteBuffer/Unsafe which are all the same thing really. The Unsafe class is at the bottom of this gang and is the key to official and semi-official access to memory in Java.
The memory allocated via Unsafe.allocatememory will be 8 byte aligned. Memory acquired via ByteBuffer.allocateDirect will ultimately go through the Unsafe.allocatememory but will differ in 2 important ways:

  1. ByteBuffer memory will be zero-ed out.
  2. Up until JDK6 direct byte buffers were page aligned at the cost of allocating an extra page of memory for every byte buffer allocated. If you allocated lots of direct byte buffers this got pretty expensive. People complained and as of JDK7 this is no longer the case. This means that direct ByteBuffer are now only 8 byte aligned.
  3. Less crucial, but convenient: memory allocated via ByteBuffer.allocateDirect is freed as part of the ByteBuffer object GC. This mechanism is only half comforting as it depends on the finalizer being called[UPDATE: things are a tad more complex than this, but this is not the topic of this post... DirectByteBuffer cleanup is done by a sun.misc.Cleaner, which is a PhatomRefeference to the buffer and will trigger deallocation when the PhantomReference is processed, see the code for more details], and that is not much to depend on.

Allocating an aligned ByteBuffer

No point beating about the bush, you'll find it's very similar to how page alignment works/used to work for ByteBuffers, here's the code:

To summarize the above, you allocate as much extra memory as the required alignment to ensure you can position a large enough memory slice in the middle of it.


Comparing Aligned/Unaligned access performance

Now that we can have an aligned block of memory to play with, lets test drive some theories. I've used Caliper as the benchmark framework for this post (it's great, I'll write a separate post on my experience/learning curve) [UPDATE: This post is from the dark pre-JMH days, these days you should NOT use Caliper, use JMH instead] and intend to convert previous experiments to use it when I have the time. The theories I wanted to test out in this post are:
Theorem I: Type aligned access provides better performance than unaligned access.
Theorem II: Memory access that spans 2 cache lines has far worse performance than aligned mid-cache line access.
Theorem III: Cache line access performance changes based on cache line location.
To test the above theorems I put together a small experiment/benchmark, with an algorithm as follows:
  1. Allocate a page aligned memory buffer of set sizes: 1,2,4,8,16,32,64,128.256,512,1024,2048 pages. Allocation time is not measured but done up front. The different sizes will highlight performance variance which stems from the cache hierarchy of sizes.
  2. We will write a single long per cache line (iterate through the whole memory block), then go back and read the written values (iterate through the whole memory block). There are usually 64 cache lines in a page (4096b/64b case), but we can only write 63 longs which will 'straddle' 2 lines, so the non-straddled offset will skip the first line to have the same number of operations.
  3. Repeat step 2 (2048/(size in pages)) times. The point is to do the same number of memory access operations per experiment.
Here is the code for the experiment:


Before moving on to the results please note that this test is very likely to yield different results on different hardware, so your mileage is very likely to vary. If you find the time to run the test on your own hardware I'd be very curious to compare notes. I used my laptop, which has an i5-2540M processor(Sandy Bridge, dual core, hyper threaded, 2.6Ghz). The L1 Cache is 32K, L2 is 256K and L3 is 3M. This is important in the context of the changes in behaviour we would expect to see as the data set exceeds the capacity of each cache. Should you run this experiment on a machine with different cache allocations, expect your results to vary in accordance.
This experiment is demonstrating a very simple use case(read/write long). There is no attempt to enjoy the many features the CPU offers which may indeed stronger alignment than simple reading and writing. As such take the results to be limited in scope to this use case alone.
Finally, note that the charts reflect relative performance to offset 0 memory access. As the performance varied also as a function of memory buffer size I felt this helps highlight the difference in behaviour which is related to offset rather than size. The effect of the size of the memory buffer is reflected in this chart, showing time as function of size for offset 0:
The chart shows how the performance is determined by the cache the memory buffer fits into. The caches size in pages is 8 for L1, 64 for L2, and 768 for L3 which correspond to the steps(200us, 400us, 600us) we see above, with a final step into main memory(1500us). While not the topic at hand it is worth noting the effect a reduced data set size can have on your application performance, and by extension the importance of realistic data sets in benchmarking.


Theorem I: Type aligned access provides better performance than unaligned access - NOT ESTABLISHED (for this particular use case)

To test Theorem I I set offset to values 0 to 7. Had a whirl and to my surprise found it made no bloody difference! I double and triple checked and still no difference. Here's a chart reflecting the relative cost of memory access:

What seems odd is the difference in performance for the first 4 byte, which are significantly less performant then the rest for memory buffer sizes which fit in the L1 cache(32k = 4k * 8 = 8 pages). The rest show relatively little variation and for the larger sizes there is hardly any difference at all. I have been unable to verify the source of the performance difference...
What is this about? Why would Mr. Drepper and many others on the good web lie to me? As it turns out Intel in their wisdom have sorted this little nugget out for us recently with Nehalem generation of CPUs, such that unaligned type access has no performance impact. This may not be the case on other non-Intel CPUs, or older Intel CPU. I ran the same experiment on my i5 laptop and my Core2 desktop, but could not see a significant difference. I have to confess I find this result a bit alarming given how it flies in the face of accepted good practice. A more careful read of Intel's Performance Optimization Guide reveals the recommendation to align your type stands, but it is not clear what adverse effects it may have for the simple use case we have here. I will attempt to construct a benchmark aimed at uncovering those issues in a further post perhaps. For now it may comfort you to know that breaking the alignment rule seems to not be the big issue it once was on x86 processors. Note that behaviour on non-x86 processors may be wildly different.


Theorem II: Memory access that spans 2 cache lines has far worse performance than aligned mid-cache line access - CONFIRMED

To test Theorem II I set the offset to 60. The result was a significant increase in the run time of the experiment. The difference was far more pronounced on the Core2 (x3-6 the cost of normal access) then on the i5 (roughly x1.5 the cost of normal access), and we can look forward to it being less significant as time goes by. This result should be of interest to anybody using direct memory access as the penalty is quite pronounced. Here's a graph comparing offset 0,32 and 60:

The other side effect of cache line straddling is loss of update atomicity, which is a concern for anyone attempting concurrent direct access to memory. I will go back to the concurrent aspects of aligned/unaligned access in a later post.


Theorem III: Cache line access performance changes based on cache line location - NOT ESTABLISHED

This one is based on Mr. Dreppers article:
3.5.2 Critical Word Load

Memory is transferred from the main memory into the caches in blocks which are smaller than the cache line size. Today 64 bits are transferred at once and the cache line size is 64 or 128 bytes. This means 8 or 16 transfers per cache line are needed.
The DRAM chips can transfer those 64-bit blocks in burst mode. This can fill the cache line without any further commands from the memory controller and the possibly associated delays. If the processor prefetches cache lines this is probably the best way to operate.
If a program's cache access of the data or instruction caches misses (that means, it is a compulsory cache miss, because the data is used for the first time, or a capacity cache miss, because the limited cache size requires eviction of the cache line) the situation is different. The word inside the cache line which is required for the program to continue might not be the first word in the cache line. Even in burst mode and with double data rate transfer the individual 64-bit blocks arrive at noticeably different times. Each block arrives 4 CPU cycles or more later than the previous one. If the word the program needs to continue is the eighth of the cache line, the program has to wait an additional 30 cycles or more after the first word arrives
To test Theorem III I set the offset values to the different type aligned locations on a cache line for a long: 0,8,16,24,32,40,48,56. My expectation here was to see slightly better performance for the 0 location as explained in Mr. Drepper's paper, with degrading performance as you get further from the begining of the cache line, at least for the large buffer sizes where data is always fetched from main memory. Here's the result:

The results surprised me. As long as the buffer fit in my L1 cache, writing/reading from the first 4 bytes was significantly more expensive than elsewhere on the line, as discussed in Theorem I, but the other locations did not have measurable differences in cost. I pinged Martin Thompson which pointed me at the Critical Word First feature/optimization explained here:
Critical word first takes advantage of the fact that the processor probably only wants a single word by signaling that it wants the missed word to appear first in the block.  We receive the first word in the block (the one we actually need) and pass it on immediately to the CPU which continues execution.  Again, the block continues to fill up in the "background".
I was unable to determine when exactly Intel introduced the feature to their CPU's, and I'm not sure which processors fail to supply it.

Conclusions/Takeaways

Of the 3 concerns stated, only cache line straddling proved to be a significant performance consideration. Cache line straddling impact is diminishing in later Intel processors, but is unlikely to disappear altogether. As such it should feature in the design of any direct memory access implementation and may be of interest to serializing/de-serializing code.
The other significant factor is memory buffer size, which is obvious when one considers the cache hierarchy. This should prompt us to make an effort towards more compact memory structures. In light of the negligible cost of type mis-alignment we may want to skip type alignment driven padding of structures when implementing off-heap memory stores.
Finally, this made me realize just how fast moving is the pace of development in hardware which invalidates past conventional wisdom/assumptions. So yet another piece of evidence validating the call to 'Measure, Measure, Measure' all things performance.

Running the benchmarks yourself

  1. Code is on GitHub
  2. Run 'ant run-unaligned-experiments'
  3. Wait... it takes a while to finish
  4. Send me the output?
To get the most deterministic results you should run the experiments pinned to a core which runs nothing else, that would reduce noise from other processes 'polluting' the cache.

Many thanks to Martin, Aleksey Shipilev and Darach Ennis for proof reading and providing feedback on initial drafts, any errors found are completely their fault :-).

[UPADTE 22/06/2015: Experiments were repeated in JMH form, arriving at similar conclusions with great insight and cross platform testing by Aleksey Shipilev.]

Second part is here: Alignment, Concurrency and Torture