Showing posts with label False Sharing. Show all posts

Monday, 27 July 2015

JMH perfasm explained: Looking at False Sharing on Conditional Inlining

There is an edge that JMH (read the jmh resources page for other posts and related nuggets) has over other frameworks. That edge is so sharp you may well cut yourself using it, but given an infinite supply of bandages you should definitely use it :-) This edge is the ultimate profiler, the perfasm (pronounced PERF-AWESOME!, the exclamation mark is silent). I've been meaning to write about it for a while and as it just saved my ass recently...

SpscGrowableArrayQueue's False Sharing Issue

JCTools includes a specialized SPSC (single-producer/consumer) bounded queue aimed at actor systems, the SpscGrowableArrayQueue. This queue is quite neat because it is combining the compactness of a linked queue with the awesome throughput of an array backed queue. The idea is quite simple, and similar in spirit to an ArrayList:
  1. Start with a small buffer, default to 16 elements
  2. As long as the queue doesn't grow beyond that just stay small
  3. If on offer you find that the queue is full double the size of the underlying buffer
The mechanics of the queue resizing, handling intermediate queue states, and detecting a new buffer from the consumer are a bit involved and will perhaps be expanded on some other day.
Because the queue is geared at actor systems per queue footprint is important, so I reworked the memory layout of SpscArrayQueue and skimped on the padding where possible. If you have no idea what I mean by padding, and why it is done you can read the following posts:
  1. False sharing and the MESI protocol details related to cached counters: This explores the motivation of padding fields in the first place
  2. Discovering and controlling object layout(Using an early version of JOL): This show cases the JOL tool and how it should be used to discover object layout
  3. SPSC Revisited - part I: An empiricist tale: This post discusses the inlining of counters into a queue use inheritance to control field order and introduce padding. In this post I show how to pad the counter from each other and also how to pre/post pad the class and buffer.
  4. A more high level summary of false sharing is given in this post
With an overhead of roughly 128b per padding this was instrumental to reducing the high memory cost per queue. The hot counters were still padded from each other, but the class pre/post padding were removed as well as the padding of the elements array.
So, I gave up on some of the padding, but reasoned that in most cases this should not make a difference because the hottest fields were still padded from each other.

Why so slow?

Now, I expect a queue that is very similar to SpscArrayQueue, but adds some features to be slower. There's just very little you can do about this, doing more will cost you something. But given that resizing is a rather exceptional event for this queue I thought this will be a minor hit, maybe 10-20% reduction in performance (for a certain definition of performance). JCTools has some benchmarks included and I ran the QueueThroughputBackoffNone which will have a producer and consumer threads chewing on the queue as hard as they can.
Since the numbers are not very important here, I'll stick to running benchmarks on my laptop (an MBP 11,1/ Ubuntu 15.04/Zulu JDK8u45 - Zulu is a supported and tested OpenJDK build) in this post. Rest assured that I have confirmed on real hardware the same results. The results I quote below are the pollsMade figure which reflects the actual delivered throughput.
To my puzzlement I found:
SpscArrayQueue          361.223 ±  7.156  ops/us
SpscGrowableArrayQueue   64.277 ± 31.803  ops/us

Crap performance and terrible variance, bugger me sideways.
Looking at the code, I thought there must be something I was doing to upset the mighty JIT spirits. Maybe my methods were too big? My branches too unpredictable? My variable names too offensive? So I tweaked the code this way and that, looked at the inlining log (-XX:+PrintInlining) and the assembly (-XX:+PrintAssembly/-XX:CompileCommand=print,*) I got some minor improvements, but it mostly still sucked. What's wrong? A quick look at "-prof perfasm" and a fair amount of head scratching lead to the answer. The code (before and after) is on github, the main focus for this post is perfasm and its usage so I won't dive into it.

Before we start: How does perfasm work?

To use perfasm you'll need a Linux(or Windows) OS, running on real hardware, the relevant perf tool installed, and a JVM setup to print assembly.
Perf is (amongst other things) an instruction level profiler, of the kind that don't usually work with Java traditionally (though things are slowly changing). One of the features offered by perf is the "perf record/annotate" workflow. Perf interrupts your process repeatedly and records the current PC (program counter) at each sample. This sampling of the program counter is recorded over a period of time to be post processed by the annotate feature which correlates samples to methods, lines of code and assembly instructions. The challenge for perf when dealing with Java code is that the binary form of each method only exists for the duration of that process lifetime. This means the PC is mostly referring to methods that are nowhere to be found when the annotation stage comes along.
To summarize: perf record works, but perf annotate is broken for Java.
To make perfasm work JMH captures the JVM compiler outputs by enabling the following flags:
  -XX:+UnlockDiagnosticVMOptions
  -XX:+LogCompilation
  -XX:LogFile=...
  -XX:+PrintAssembly
  -XX:+PrintInterpreter
  -XX:+PrintNMethods
  -XX:+PrintNativeNMethods
  -XX:+PrintSignatureHandlers
  -XX:+PrintAdapterHandlers
  -XX:+PrintStubCode
  -XX:+PrintCompilation
  -XX:+PrintInlining
  -XX:+TraceClassLoading
  -XX:PrintAssemblyOptions=syntax
The data collected here allows perfasm to do the annotation process by itself. I'll not bore you with the details of the output processing, but hat off to Mr. Shipilev who ploughed through the gory mess and made this work. The end result is a detailed output offering you the assembly of the hottest regions in your program, along with a list of the top hottest methods including both native and Java parts of the stack.
Because perf allows the recording of any number of events the definition of hottest depends on the events you choose to profile. The default events are cycles and instructions, but you can specify any number of events (E.g. -Djmh.perfasm.events=cycles,cache-misses). The first event specified will be the 'hotness' qualifier.

What do you get?

The perfasm output is split into 4 sections:
  1. Annotated assembly output for the top HOT regions(titled "Hottest code regions (>10.00% "cycles" events):")
  2. A list of the hot regions in your benchmark (titled "[Hottest Regions]"). This is the list of compiled methods inclusive of native methods, which is why we have the next section.
  3. A list of the hottest methods after inlining, so only java methods in this section (titled "[Hottest Methods (after inlining)]").
  4. A distribution of the cycles between types of regions (titled "[Distribution by Area]"). This will inform you of how the split goes between compiled code, kernel, JVM etc.
The most interesting of the 4 sections (and the only one I'm going to explain here) is the annotated hot regions section. I tend to edit the output of assembly spouting tools to make it more readable, but for the sake of explaining what's what here's the original output with footnotes:
To focus on the main features I trimmed out allot of the assembly code, which is where you see the "<MORE OF SAME/>" comments. Note the legend at the start of the output describing the 2 left most columns: cycles and instructions sample percentages.
Here's the footnotes explained:
  1. (Line 7) This column is the instruction address. This is important as this column is both how perfasm matches the perf record output with the PrintAssembly output and how poor sods like yours truely have to look for jump destinations in the code.
  2. (Line 7) This column has the actual instructions, in AT&T syntax (src -> dst).
  3. (Line 7) This column is the instruction annotation generated by PrintAssembly. It is not always correct, but it's helpful in connecting the dots. Multi-level inlining of methods can be seen in action everywhere.
  4. (Line 12) The condition/loop edge annotation is a wonderful recent addition to perfasm. It makes life marginally more bearable for the assembly consumer by connecting the jumps with their destinations. This is the start point annotation ""
  5. (Line 16) This is the end point annotation ""
When looking at this you will be searching for suspect hot spots in the code. Some instruction which is chewing away your cycles. If you're in luck you'll be able to tweak your code just right to side step it and then you are off and away :-)

Back on Track: Show me the cycles!

Right, so I point Captain Awesome at my benchmark and what do I see (trimmed addresses and edges as there's no important conditions here, also trimmed package names and moved code annotation left):
This instruction, eating 30% of my cycles (line 7, needs HEALING!), is part of a guard generated to ensure that inlining the poll method call is still a valid decision, that the instance observed at the callsite is of the class for which we inlined the poll method. This is not really a Java code line, this is the aftermath of inlining a virtual call (through an interface, see Aleksey's method dispatch inlining article to learn more on inlining).
To be fair, the above is kind of hard to understand. Why is a comparison between a constant and a register eating 30% of the cycles? according to every instruction 'cost' manual this should take 1 cycle (and the CPU can do 3-4 of them in parallel too), this is obviously not the instruction I'm looking for.
This is a phenomena known as 'skid' where the reported instruction at a given sample is inaccurate because modern CPUs are complicated. See the following dialogue on the linux-perf-user mailing list:
> I think Andi mentioned this to me last year -- that instruction profiling was no longer reliable. 
It never was. 
> Is this due to parallel and out-of-order execution? (ie, we're sampling the instruction pointer, but that's set to the resumption instruction, not the instructions being processed in the backend?). 
Most problems are due to 'skid': It takes some time to trigger the profiling interrupt after the event fired. [...] There are also other problems, for example an event may not be tied to an instruction. Some events have inherently large skid.
This sounds grim, but at the end of the day this is as accurate as profiling can get. It's not perfect, but it's still very valuable and you get used to it (there are ways to minimize skid discussed in the link, I've not tried those).
What you end up doing is looking for instructions just before the blamed instruction, or instructions on which the blamed instruction is dependant, which may be more reasonably blamed for the bottleneck. Given the CMP is not the problem, we must ask why would the CPU spend so much time at it? A CMP or a TEST will often get blamed for the price of the load into the registers they use, in this case the CMP is most probably being blamed for the load of the queue type from the object header one instruction back:
"0x8(%r12,%r11,8),%r8d  ; implicit exception: dispatches to 0x00007f83c93f929d"
It doesn't help that the comment talks about some implicit exception (this is an implicit null check), where it could say "getkid(q) + implicit_nullchk(q)" or something similar to indicate we are loading the kid (klass id) from the object header (see object header layout details here).
Now that I had pointed a finger at this operation, I was still quite confused. This was not an issue for any of the other queues, why would loading the kid be such a bottleneck in this case? Maybe I'm wrong about this (always a good assumption)? To prove this is the issue I created a duplicate of the original benchmark where I use the SpscGrowableArrayQueue directly instead of going via the interface, for comparison I also benchmarked the SpscArrayQueue in the same fashion:
SpscArrayQueue          369.544 ±  1.535  ops/us
SpscGrowableArrayQueue  272.021 ± 12.133  ops/us

Now that's more like it! the expected 20% difference is more like 30%, but this is much closer. This still begs the question, why is the type check for SpscGrowableArrayQueue so expensive? We can see that for SpscArrayQueue this makes very little difference, how is SpscGrowableArrayQueue different?

Messing with the KID

I had a long hard look at this issue, which didn't help, then slept on it, which did help, and realized the problem here is that the object header is false-sharing with the producer fields. When I trimmed down the padding on this class in an effort to minimize allocation, I removed the array post and pre-padding as well as the class pre/post padding and reasoned that for the most part I need not worry about the object's neighbours false sharing. What I failed to realize was that the consumer and producer threads might be frequently hitting the object header, in this benchmark on every call. Once I realized this was the issue I reinstated the pre-padding such that the producer index is far enough from the object header to stop interfering with it and the problem went away (see before and after, it's a messy diff as I fixed some other niggles while I was there, you can take the last version and play with adding/removing the padding and reordering the index and cold fields to verify my claims).
Here's the (slightly trimmed for readability) perfasm output for the same conditional inlining check in the padded version:

As an interesting side note, this issue was not visible in the hand rolled throughput benchmarks. This is because in those benchmarks the queue is hoisted into a variable before the consume/produce loop which means the conditional inlining check can be done out of loop as well. This is great for getting nice numbers but hides an issue which users are likely to hit. Credit goes to JMH for herding benchmarks down a path which forces these issues into the measured scope.

Summary

The main focus of this post is perfasm, I hope it helps get you started on using it. The broader context in which you would use this tool is a less explicit background. I use perfasm regularly, but I'm also reasonably happy to look at assembly and compiler annotation which I know most people are not. I find it to be invaluable in issues, like the one described in this post, where the cost is between the Java lines rather than the lines themselves. Any profiler can give you a broad feel of where performance bottlenecks are, and a non-safepoint-biased profiler can show you the hottest line of code. What a Java profiler will not tell you is about the generated JVM code between your lines. It will attribute the cost of those instructions to the nearest Java line, and that can become a very confusing chase.
It also worth pointing out that any nano-benchmark (measuring operations in the 0-500 nanoseconds range) practically requires you to look at the assembly for it's analysis. But 500ns can still be an aweful lot of code and an assembly level profiler is very handy. At this point it worth mentioning the Oracle Solaris Studio (first prize for least known profiler every year since release). It is a great assembly level profiler, and just generally a great profiler. If your measurement needs to take place outside the cosy comforts of a JMH benchmark I would recommend you give it a spin.
Finally, this investigation came in the context of a workflow that is followed in the development of JCTools. I would loosely describe it as follows:
  1. Implement new feature/data structure
  2. Reason about expected impact/performance as part of design and implementation
  3. Test expectations using the existing set of benchmarks
  4. Expectations are far off the mark (if not... not sure, will figure it out when it happens)
  5. Dig in until either expectations or code are cured.
This has a whiff of scientific exploration to it, but I assure you it is not done quite so seriously and I often fail to follow my own advice (or worse other people's advice). The habit of testing performance assumptions/expectation has offered me many an afternoon spent banging my head on a variety of surfaces. Perfasm has been instrumental in reducing the amount of head banging, but I fear nothing short of permanent brain damage will actually solve the problem.
This post has been kindly reviewed by Aleksey Shipilev, Darach Ennis and Richard Warburton. Any remaining errors are entirely their fault ;-)

Thursday, 26 June 2014

Notes on False Sharing

{This post is part of a long running series on lock free queues, checkout the full index to get more context here}
I've recently given a talk on queues and related optimisations, but due to the limitations of time, the Universe and Everything else had to cut short the deep dive into false sharing. Here however I'm not limited by such worldly concerns, so here is more detail for those who can stomach it.

What mean False Sharing?

Described before on this blog and in many other places (IntelusenixMr. T), but assuming you are not already familiar with the issue:
"false sharing is a performance-degrading usage pattern that can arise in systems with distributed, coherent caches at the size of the smallest resource block managed by the caching mechanism. When a system participant attempts to periodically access data that will never be altered by another party, but that data shares a cache block with data that is altered, the caching protocol may force the first participant to reload the whole unit despite a lack of logical necessity. The caching system is unaware of activity within this block and forces the first participant to bear the caching system overhead required by true shared access of a resource." - From Wikipedia
Makes sense, right?
I tried my hand previously at explaining the phenomena in terms of the underlying coherency protocol which boils down to the same issue. These explanations often leave people still confused and I spent some time trying to reduce the explanation so that the idea can get across in a presentation... I'm pretty sure it still left people confused.
Let's try again.
The simplest explanation I've come up with to date is:
  1. Memory is cached at a granularity of a cache line (assumed 64 bytes, which is typical, in the following examples but may be a smaller or larger power of 2, determined by the hardware you run on)
  2. Both reading and writing to a memory location from a particular CPU require the presence of a copy of the memory location in the reading/writing CPU cache. The required location is 'viewed' or cached at the granularity of a cache line.
  3. When a line is not in a threads cache we experience a cache miss as we go searching for a valid copy of it.
  4. Once a line is in our cache it may get evicted (when more memory is required) or invalidated (because a value in that line was changed by another CPU). Otherwise it just stays there.
  5. A write to a cache line invalidates ALL cached copies of that line for ALL CPUs except the writer.
I think there is a mistaken intuition most of us have when it comes to memory access, which is that we think of it as direct. In reality however you access memory through the CPU cache hierarchy and it is in the attempt to make this system coherent and performant that the hardware undoes our intuition. Rather than thinking of all CPUs accessing a global memory pool we should have a mental model that is closer to a distributed version control system as illustrated in this excellent post on memory barriers.
Given the above setting of the stage we can say that false sharing occurs when Thread 1 invalidates (i.e writes to) a cache line required by Thread2 (for reading/writing) even though Thread2 and Thread1 are not accessing the same location.
The cost of false sharing is therefore observable as cache misses, and the cause of false sharing is the write to the cache line (coupled with the granularity of cache coherency). Ergo, the symptom of false sharing can be observed by looking at hardware events for your process or thread:
  • If you are on linux you can use perf. (Checkout the awesome perf integration in JMH!)
  • On linux/windows/mac Intel machines there is PCM.
  • From Java you can use Overseer
  • ... look for hardware counters on google.
Now assuming you have established that the number of cache misses you experience is excessive, the challenge remains in finding the sources of these cache misses. Sadly for Java there is no free utility that I'm aware of which can easily point you to the source of your false sharing problem, C/C++ developers are spoilt for choice by comparison. Some usual suspects to consider however are any shared data constructs, for example queues.


Active False Sharing: Busy Counters

Lets start with a queue with 2 fields which share the same cache line where each field is being updated by a separate thread. In this example we have an SPSC queue with the following structure:
Ignoring the actual correct implementation and edge cases to make this a working queue (you can read more about how that part works here), we can see that offer will be called by one thread, and poll by another as this is an SPSC queue for delivering messages between 2 threads. Each thread will update a distinct field, but as the fields are all jammed tight together we know False Sharing is bound to follow.
The solution at the time of writing seems to be the introduction of padding by means of class inheritance which is covered in detail here. This will add up to an unattractive class as follows:
Yipppeee! the counters are no longer false sharing! That little Pad in the middle will make them feel all fresh and secure.


Passive False Sharing: Hot Neighbours

But the journey is far from over (stay strong), because in False Sharing you don't have to write to a shared cache line to suffer. In the above example both the producer and the consumer are reading the reference to buffer which is sharing a cache line with naughty Mr. consumerIndex. Every time we update consumerIndex an angel loses her wings! As if the wings business wasn't enough, the write also invalidates the cache line for the producer which is trying to read the buffer so that it can write to the damn thing. The solution?
MORE PADDING!!
Surely now everyone will just get along?

The Object Next Door

So now we have the consumer and the producer feverishly updating their respective indexes and we know the indexes are not interfering with each other or with buffer, but what about the objects allocated before/after our queue object? Imagine we allocate 2 instances of the queue above and they end up next to each other in memory, we'd be practically back to where we started with the consumerIndex on the tail end of one object false sharing with the producer index at the head end of the other. In fact, the conclusion we are approaching here is that rapidly mutated fields make very poor neighbours altogether, be it to other fields in the same class or to neighbouring classes. The solution?
EVEN MORE PADDING!!! 
Seems a tad extreme don't it? But hell, at least now we're safe, right?

Buffers are people too

So we have our queue padded like a new born on it's first trip out the house in winter, but what about Miss buffer? Arrays in Java are objects and as such the buffer field merely point to another object and is not inlined into the queue (as it can be in C/C++ for instance). This means the buffer is also subject to potentially causing or suffering from false sharing. This is particularly true for the length field on the array which will get invalidated by writes into the first few elements of the queue, but equally true for any object allocated before or after the array. For circular array queues we know the producer will go around writing to all the elements and come back to the beginning, so the middle elements will be naturally padded. If the array is small enough and the message passing rate is high enough this can have the same effect as any hot field. Alternatively we might experience an uneven behaviour for the queue as the elements around the edges of the array suffer false sharing while the middle ones don't.
Since we cannot extend the array object and pad it to our needs we can over-allocate the buffer and never use the initial/last slots:
We cannot prevent false sharing between neighbours and the array length, what we can do is hoist it into our own class field and use our copy instead of the buffer field. This can also result in better locality if the hoisted length value is hosted in a field alongside the array itself.
Note that this is costing us some computational overhead to compute the offset index instead of the natural one, but in practice we can implement queues such that the we achieve the same effect with no overhead at all.

Protection against the Elements

While on this topic (I do go on about it... hmmm) we can observe that the producer and the consumer threads can still experience false sharing on the cache line holding adjacent elements in the buffer array. This is something we can perhaps handle more effectively if we had arrays of structs in Java (see the value types JEP and structured arrays proposal), and if the queue was to be a queue of such structs. Reality being the terrible place that it is, this is not the case yet. If we could prove our application indeed suffered from this issue, could we solve it?
Yes, but at a questionable price...
If we allocate extra elements for each reference we mean to store in the queue we can use empty elements to pad the used elements. This will reduce the density of each cache line and as a result the probability of false sharing as less and less elements are in a cache line. This comes a high cost however as we multiply the size of the buffer to make room for the empty slots and actively sabotage the memory throughput as we have less data per read cache line. This is an optimization I am reluctant to straight out recommend as a result, but what the hell? sometimes it might helps.

Playing with Dirty Cards

This last one is a nugget and a half. Usually when people say: "It's a JVM/compiler/OS issue" it turns out that it's a code issue written by those same people. But sometimes it is indeed the machine.
In certain cases you might not be the cause of False Sharing. In some cases you might be experiencing False Sharing induced by card marking. I won't spoil it for you, follow the link.

Summary

So there you have it, 6 different cases of False Sharing encountered in the process of optimizing/proofing the piddly SPSC queue. Each one had an impact, some more easily measured than others. The take away here is not "Pad every object and field to death" as that will be detrimental in most cases, much like making every field volatile. But this is an issue worth keeping in mind when writing shared data structures, and in particular when considering highly contended ones.
We've discussed 2 types of False Sharing:

  • Active: where both threads update distinct locations on the same cache line. This will severely impact both threads as they both experience cache misses and cause repeated invalidation of the cache line.
  • Passive: where one thread writes to and another reads from distinct locations on the same cache line. This will have a major impact on the reading thread with many reads resulting in a cache miss. This will also have an impact on the writer as the cache line sharing overhead is experienced.
These were identified and mitigated in several forms:

  1. Neighbouring hot/hot fields (Active)
  2. Neighbouring hot/cold fields (Passive)
  3. Neighbouring objects (potential for both Active and Passive)
  4. Objects neighbouring an array and the array elements (same as 3, but worth highlighting as a subtlety that arrays are separate objects)
  5. Array elements and array length field (Passive as the length is never mutated)
  6. Distinct elements sharing the same cache line (Passive in above example, but normally Active as consumer nulls out the reference on poll)
  7. -XX:+UseCondCardMark - see Dave Dice article

What should you do?
  1. Consider fields concurrently accessed by different threads, in particular frequently written to fields and their neighbours.
  2. Consider Active AND Passive false sharing.
  3. Consider (and be considerate to) your neighbours.
  4. All padding comes at the cost of using up valuable cache space for isolation. If over used (like in the elements padding) performance can suffer.
And finally: love thy neighbour, just a little bit and with adequate protection and appropriate padding, but still love'em.
Belgium! Belgium! Belgium! Belgium! Belgium! Belgium! Belgium! Belgium! Belgium! Belgium! Belgium!

Sunday, 15 September 2013

Diving Deeper into Cache Coherency

I recently gave a talk about Mechnical Sympathy at Facebook, which was mostly a look at the topic through the SPSC queue optimization series of posts. During the talk I presented the optimisation step (taken in Martin's original series of queue implementations) of adding a cache field for the head and tail. Moving from this:

To this:


This change yields a great improvement in throughput which I explained to be down to the reduction in coherency traffic between the cores. This is:
  1. Not what I stated previously here.
  2. A very brief and unsatisfying explanation.
I shall try and remedy that in this post.


Penance

In my original step by step post I explained the benefit of the above optimization is the replacement of a volatile read with a plain read. Martin was kind enough to gently correct me in the comments:
"The "volatile read" is not so much the issue. The real issues come from the read of the head or tail from the opposite end will pretty much always result in a cache miss. This is because the other side is constantly changing it."
and I argued back, stating the JIT compiler can hoist the field into a register and wistfully wishing I could come up with an experiment to prove one way or the other.  I was mostly wrong and Martin was totally right. 
I say mostly and not entirely because eliminating volatile reads is not a bad optimization and is responsible for part of the perf improvement. But it is not the lion share. To prove this point I have hacked the original version to introduce volatile reads (but still plain writes) from the headCache/tailCache fields. I won't bore you with the code, it's using the field offset and Unsafe.getLongVolatile to do it.
I ran the test cross core for 30 times and averaged the summary results. Running on new hardware (so no reference point to prev. quoted results) i7-4700MQ/Ubuntu 13.04/JDK7u25. Here are the results, comparing Original21 (head/tail padded, no cache fields), Original3 (head/tail padded, head/tailCache padded) and VolatileRead (same as Original3, but with volatile read of cache fields):

Original21:     65M ops/sec
Original3:     215M ops/sec
VolatileRead:  198M ops/sec

As we can see, there is no massive difference between Original3 and VolatileRead (especially when considering the difference from Original21), leading me to accept I need to buy Martin a beer, and apologize to any reader of this blog who got the wrong idea reading my post.
Exercise to the reader: I was going to run the above with perf to quantify the impact on cache-misses, but as perf doesn't support this functionality on Haswell I had to let it go. If someone cares to go through the exercise and post a comment it would be most welcome.


What mean cache coherency?

Moving right along, now that we accept the volatile read reduction is not the significant optimization here, let us dig deeper into this cache coherency traffic business. I'll avoid repeating what is well covered elsewhere (like cache-coherence, or MESIF on wikipedia, or this paper, some excellent examples here, and an animation for windows users only here) and summarize:
MESI State Diagram
  • Modern CPUs employ a set of caches to improve memory access latency.
  • To present us with a consistent view of the world when concurrent access to memory happens the caches must communicate to give us a coherent state.
  • There are variations on the protocol used. MESI is the basic one. Recent intels use MESIF. In the examples below I use MESI as the added state in MESIF adds nothing to the use case.
  • The guarantee they go for is basic:
    • One change at a time (to a cache line): A line is never in M state in more than one place. 
    • Let me know if I need a new copy: If I have a copy and someone else changed it I need to get me a new copy. (My copy will move from Shared to Invalid)
All of this happens under the hood of your CPU without you needing to lose any sleep, but if we somehow cause massive amounts of cache coherency traffic then our performance will suffer. One note about the state diagram. The observant reader (thanks Darach) will notice the I to E transition for Processor Write(PW) is in red. This is not my diagram, but I think the reason behind it is that the transition is very far from trivial (or a right pain in the arse really) as demonstrated below.


False Sharing (once more)

False sharing is a manifestation of this issue where 2 threads are competing to write to the same cache line which is constantly Invalid in their own cache.

Here's a blow by blow account of false sharing in terms of cache coherency traffic:
  1. Thread1 and Thread2 both have the false Shared cache line in their cache
  2. Thread1 modifies HEAD (state goes from S to E), Thread2's copy is now Invalid
  3. Thread2 wants to modify TAIL but his cache line is now in state I, so experiences a write miss:
    1. Issue a Read With Intent To Modify (RWITM)
    2. RWITM intercepted by Thread1
    3. Thread1 Invalidates own copy
    4. Thread1 writes line to memory
    5. Thread2 re-issues RWITM which results in read from memory (or next layer cache)
  4. Thread1 wants to write to HEAD :( same song and dance again, the above gets in it's way etc.

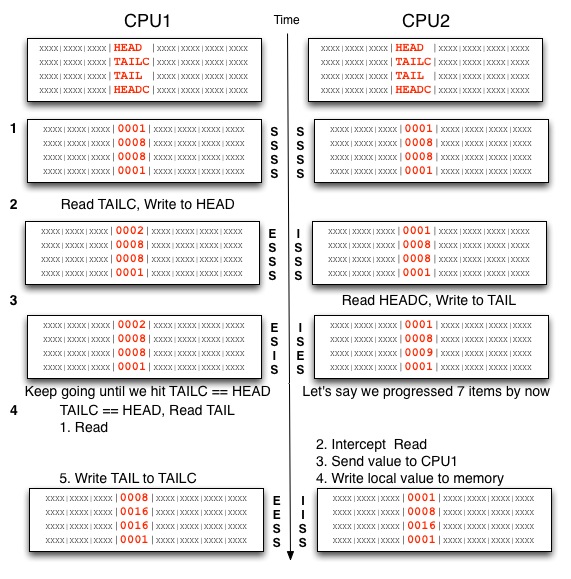
The diagram to the right is mine, note the numbers on the left track the explanation and the idea was to show the cache lines as they mutate on a timeline. Hope it helps :-).


Reducing Read Misses

So False Sharing is really bad, but this is not about False Sharing (for a change). The principal is similar though. With False Sharing we get Write/Read misses, the above manoeuvre is about eliminating Read misses. This is what happens without the HEADC/TAILC fields (C for cache):
  1. Thread1 and Thread2 both have the HEAD/TAIL  cache lines in Shared state in their cache
  2. Thread1 modifies HEAD (state goes from S to E), Thread2's copy is now Invalid
  3. Thread2 wants to read HEAD to check if the queue wrapped, experiences a Read Miss:
    1. Thread2 issues a request for the HEAD cache line
    2. Read is picked up by Thread1
    3. Thread1 delivers the HEAD cache line to Thread2, the request to memory is dropped
    4. The cache line is written out to main memory and now Thread1/2 have the line in Shared state
This is not as bad as before, but is still far from ideal. The thing is we don't need the latest value of HEAD/TAIL to make progress, it's enough to know that the next increment to our counter is available to be used. So in this use case, caching the head/tail gives us a great win by avoiding all of these Read Misses, we only hit the Read Miss when we run out of progress to be made against our cached values. This looks very different:
  1. Thread1 and Thread2 both have the HEAD/TAIL/HEADC/TAILC  cache lines in Shared state in their cache (the TAILC is only in Thread1, HEADC is only in Thread2, but for symmetry they are included).
  2. Thread1 reads TAILC and modifies HEAD (state goes from S to E), Thread2's copy is now Invalid.
  3. Thread2 reads from HEADC which is not changed. If TAIL is less than HEADC we can make progress (offer elements) with no further delay. This continues until TAIL is equal to HEADC. As long as this is the case HEAD is not read, leaving it in state M in Thread1's cache. Similarly TAIL is kept in state M and Thread2 can make progress. This is when we get the great performance boost as the threads stay out of each others way.
  4. Thread1 now needs to read TAIL to check if the queue wrapped, experiences a Read Miss:
    1. Thread1 issues a request for the TAIL cache line
    2. Request is picked up by Thread2
    3. Thread2 delivers the TAIL cache line to Thread1, the request to memory is dropped
    4. The cache line is written out to main memory and now Thread1/2 have the line in Shared state
    5. TAIL is written to TAILC (TAILC line is now E)
The important thing is that we spend most of our time not needing the latest HEAD value which means Thread2 is not experiencing as many Read Misses, with the added benefit of the threads not having to go back and forth from Shared to Exclusive/Modified state on writes. Once I have a line in the M state I can just keep modifying with no need for any coherence traffic. Also note we never experience a Write Miss.


Summary

In an ideal application (from a cache coherency performance POV) threads never/rarely hit a read or write miss. This translates to having single writers to any piece of data, and minimizing reads to any external data which may be rapidly changing. When we are able to achieve this state we are truly bound by our CPU (rather than memory access).
The takeaway here is: Fast moving data should be in M state as much as possible. A read/write miss by any other thread competing for that line will lead to reverting to S/I which can have significant performance implications. The above example demonstrates how this can achieved by caching stale but usable copies locally to another thread.

Monday, 15 July 2013

Single Producer Single Consumer Queue Revisited: An empiricist tale - part I


{This post is part of a long running series on lock free queues, checkout the full index to get more context here}
Applying lessons learnt about memory layout to prev. discussed SPSC (Single Producer Single Consumer) queue. Tackling and observing some manifestations of false sharing. Getting bitch slapped by reality.

In preparations to implement an MPMC (Many Producers Many Consumers) queue I went back to Martin Thompson's SPSC queue I dissected in detail in this blog post. I was going to use it as the basis for the new queue with a few changes and discuss the transition. In particular an opportunity offered in the implementation of said queue with the addition of the new getAndAdd intrinsic to JDK 8. I was going to... but then I thought, 'let me try a couple more things!' :-).

Where were we?

In case you can't be bothered to go back and read the whole thing again, here's a quick summary. Mr. Thompson open sourced a few samples he discusses in his presentation on lock-free algorithms, in particular a SPSC queue developed across a few stages. I broke down the stages further and benchmarked before and after to explore the effect of each optimisation as it is applied. I then ported the same queue into an off-heap implementation and used it to demonstrate a fast IPC mechanism capable of sending 135M messages per second between processes. The queue demonstrated the following techniques:
Snowman contemplating
evolution
  • lock free, single writer principle observed.
  • Set capacity to power of 2, use mask instead of modulo. 
  • Use lazySet instead of volatile write.
  • Minimize volatile reads by adding local cache fields.
  • Pad all the hot fields: head, tail, headCache,tailCache to avoid false sharing.
So... what's to improve on? There were a few niggles I had looking at this code again, some I've mentioned before. The last time I benchmarked the original queue implementation I noticed high run to run variance in the results. This was particularly prominent when running across 2 cores on the same socket or across sockets.
To expose the variance I modified the test to produce a summary line (each test runs 20 iterations, the summary is the average of the last 10 test iterations) and ran it 30 times. The results demonstrate the variance (results are sorted to highlight the range, X-axis is the run index, Y-axis is a summary of the run, SC means producer and consumer run on the same core, CC means they run across cores on the same socket):


Original queue performance
OUCH! We get half the performance 20% of the time. The results were very stable within a given run, leading me to believe there was a genuine issue at play.

So I thought, let's poke the i's and kick the t's, see if we can shake the variance out of the bugger.

Terms & Conditions

Benchmarks were carried out on a dual socket Xeon running CentOS 6 and Oracle JDK 1.7u17. Affinity was set using taskset, the scripts used are included with the code as well as the raw results and the LibreOffice spread sheets used for the graphs. Furry, fluffy animals were not harmed and people of different religions and races were treated with the outmost respect and afforded equal opportunity. I ran the cross socket tests, and the data is included, but I chose not to discuss them as no improvement was made on that front and they would make this already long post longer. 


Flatten me counters!

To start off, I was not thrilled with the way the counter padding was implemented, for 2 reasons:
  1. By using container classes for the counters we introduce indirection, we could optimise by inlining the data into the queue structure.
  2. The Padded* classes only pad to one side, we are counting on the instances to be laid out together because they are instantiated together. In the right environment I'm pretty sure this can go wrong. By go wrong I mean the instances might get allocated/placed next to data modified elsewhere leading to false sharing. By inlining the counters and forcing strict order we could kill 2 bird with one stone.
To inline the counters, and provide the padding required to provide false-sharing protection I used inheritance to force layout (as outlined previously here). I used Unsafe to get field offset and implement lazySet directly into the fields inlined in my class (this is replacing the original PaddedLong/PaddedAtomicLong, the same method is used in AtomicLong to implement lazySet) the code:

It ain't pretty, but it does the job. The layout can be verified using the excellent java-object-layout tool (I format the output for brevity):
psy.lob.saw.queues.spsc1.SPSCQueue1
 offset  size     type description
      0    12          (assumed to be the object header + first field alignment)
     12     4      int ColdFields.capacity
     16     4      int ColdFields.mask
     20     4 Object[] ColdFields.buffer
     24-72  8     long L1Pad.p10-16
     80     8     long TailField.tail
     88-136 8     long L2Pad.p20-p26
    144     8     long HeadCache.headCache
    152-200 8     long L3Pad.p30-36
    208     8     long HeadField.head
    216-264 8     long L4Pad.p40-46
    272     8     long TailCache.tailCache
    280-328 8     long L5Pad.p50-56
    336                (object boundary, size estimate)

Wicked! Run the same tests above to see what happened:
Original vs. Inlined counters(I1)

We get a small improvement when running on the same core (average 3% improvement), but the cross core behaviour is actually worse. Bummer, keep kicking. 

Padding the class fields

If we look at the above memory layout, we'll notice the fields capacity, mask and buffer are left flush against the object header. This means that they are open to false sharing with other objects/data allocated on the same cache line. We can add a further love handle on that big boy to cover that front:

Note that by happy coincidence we have already padded the tail side of the fields as part of our flattening exercise. So now the layout is:
psy.lob.saw.queues.spsc3.SPSCQueue3
 offset  size     type description
      0    12          (assumed to be the object header + first field alignment)
     12     4          (alignment/padding gap)
     16-72  8     long L0Pad.p00-07
     80     4      int ColdFields.capacity
     84     4      int ColdFields.mask
     88     4 Object[] ColdFields.buffer
     92     4          (alignment/padding gap)
     96-144 8     long L1Pad.p10-16
    152     8     long TailField.tail
    160-208 8     long L2Pad.p20-26
    216     8     long HeadCache.headCache
    224-272 8     long L3Pad.p30-36
    280     8     long HeadField.head
    288-336 8     long L4Pad.p40-46
    344     8     long TailCache.tailCache
    352-400 8     long L5Pad.p50-56
    408                (object boundary, size estimate)

Try again and we get:
Original vs Inlined counters and padded class(I3)


Same single core behaviour as above, but the cross core behaviour looks stable. Sadly the cross core results are worse than the original in many cases. Good thing there is one more trick up our sleeves.

Padding the data

So, this last step may seem a bit over the top, padding the sides of the buffer as well as spacing out all the bloody fields. Surely you must be joking? I padded the buffer by allocating an extra 32 slots to the array and skipping the first 16 on access. The object layout remains the same, you'll have to imagine the extra padding (code is here). But the results are:
Original vs Inlined counters, padded class and padded data(I4)


Run fat Q! Run! This is a nice kick in the single core category (10% increase) and in the cross core it is pretty flat indeed. So when the original behaves they are much the same, but the average result is a 10% improvement. Very little variance remains.

But it's UGLY!

Got me there, indeed it is. Why do we need to go this far to get rid of flaky behaviour? This is one of
Y do we care?
them times when having a direct line to memory management really helps, and Java has always been about you not having to worry about this sort of thing. There is help on the way in the form of the @Contended annotation which would render the above class much nicer, but even then you will need to pad the buffer by yourself. If you look at how the OffHeapQueue manages this issue, you'll see that less padding is required when you know the data alignment. Sadly there is no @Align(size=byte|short|int|long|cache|page) annotation coming anytime soon, and the @Contended annotation is not clear on how you could go about marking an instance rather than a class/field as contended.

Hang on, what if we do it the other way around?

For all you logical minded people out there who think: "we applied the changes together, but not separately. What if this is all about the data padding? we could fix the original without all this fuss...". I feel your pain obsessive brothers. So I went back and added 2 variants, one of a padded data original(referred to as O2 in the graphs) and another of the padded data and inlined fields without the class field padding. I was surprised by the results:

Same Core comparison of data padding impact


Padding the data, of and by itself made things worse for the original implementation and the inlined implementation when running on the same core. Padding the data sucks!
Cross Core comparison of data padding impact
When we look at the cross core results we can see some benefit from the data padding, suggesting it is part of the issue we are trying to solve, but not the whole story.
Padding the cold fields by itself also did little for the performance, as demonstrated above, but removed some of the variance. The 2 put together however gave us some extra performance, and killed the variance issue. Why? I don't know... But there you go, holistic effects of memory layout at work.

A happy ending?

Well... sort of. You see, all the above tests were run with the following JVM options:
-XX:+UseNUMA -XX:+UseCondCardMark -XX:CompileThreshold=100000
And thus the results present a certain truth, but maybe not all of the truth for everyone all of the time... I decided to waste some electricity and rerun some variations of the above options to see what happens. Running with no JVM options I got the following:
Cross core - no JVM opts
  • I4 which is the final inlined version is still quite stable, but it's performance lags behind the other implementations.
  • O1 which is the original implementation has less variance then before (could be luck, who knows) and has the best average result.

Same core - no JVM opts

  • This time I3 (inlined counters, padded class) is the clear winner.
  • I2 (inlined counters, padded data) is second, followed by I4 and I1.
  • When running on the same core, inlining the counters delivers a minor performance win.
Running with -XX:+UseCondCardMark:
ConcCardMark cross core
  • Using CondCardMark has reduced the range somewhat, but still a fair range for all.
  • I4 and I3 are stable, but the overall best average score goes to I1 (133M).
  • I4 is overall slightly better then O1 but worse then O2(original implementation with padded data)
ConcCardMark same core
  • I1 is the best by quite a bit, followed by I4.
Running with -XX:+UseCondCardMark -XX:CompileThreshold=100000:
-XX:+UseCondCardMark -XX:CompileThreshold=100000 - Cross Core
  • With the increased compile threshold O2 has pulled to the top followed by I4 and O1.
  • I4 is looking very much like O1
  • I1, which was the clear winner a second ago, is now rubbish.

-XX:+UseCondCardMark -XX:CompileThreshold=100000 - Same Core
  • On the same core we are seeing now the same behaviour we saw in the beginning.
  • I4 is the clear winner, I1 and I3 pushed down to second place etc.
  • This is odd, why would giving the JIT more data for compilation push the performance of I1 down?
And for comparison the results from -XX:+UseNUMA -XX:+UseCondCardMark -XX:CompileThreshold=100000 presented together:
All together now - Cross Core
  • I4 is the most stable, although O2 has the best overall average throughput.
  • Comparing with all the other combinations we seem to have degraded the performance of other options on our way to find the best option for I4 :(
All together now - Same Core

What does it all mean?

At this point I got quite frustrated. The above approach was producing improvements to the variance, and even an improvement to overall performance on occasion, but the effect was not as decisive and clear as I'd have liked. Some of the variation I just could not shake, even with the best result above I4 is still moving between 110M and 120M and has a spike on either side of this range.
These results are a fine demonstration of how time consuming and error prone the estimation of performance can be. To collect the above results I had to setup the same test to run for each implementation 30 times for each of the affinity options (same core/cross core/cross socket) and repeat
for 4 JVM options combinations (8 impls * 30 runs * 3 affinity setups * 4 JVM_OPTS + extra trial and error runs... = lots of time, quite a bit of data). This result is likely to be different on different hardware, it is likely to change with JDK8, other JVM options and so on. Even with all this effort of collecting data I am very far from having a complete answer. Is this data enough to produce meaningful results/insights at all?
To a certain extent there is evident progress here towards eliminating some of the sources of the run to run variation. Looking at the above results I feel justified in my interpretation of the object layout and the test results. In running the same code on other hardware I've observed good results for I4 and similar variation for the O1, so not all is lost. But this journey is, surprisingly enough, still not over...

More, more, more!

David Hume
If you found this riveting tale of minute implementation changes and their wacky effect on performance absorbing you will love the next chapter in which:
  • I explore cross socket performance and it's implications
  • We contemplate the ownership of memory and it's impact
  • The original implementation is evolved further
  • We hit a high note with 250M ops per second
This post is long enough as is :-)

Friday, 21 June 2013

Java Concurrent Counters By Numbers

{UPDATE 03/09/14: If you come here looking for JMH related content start at the new and improved JMH Resources Page and branch out from there!}
It is common practice to use AtomicLong as a concurrent counter for reporting such metrics as number of messages received, number of bytes processed etc. Turns out it's a bad idea in busy multi-threaded environments... I explore some available/up-and-coming alternatives and present a proof of concept for another alternative of my own.
When monitoring an application we often expose certain counters via periodical logging, JMX or some other mechanism. These counters need to be incremented and read concurrently, and we rely on the values they present for evaluating load, performance or similar aspects of our systems. In such systems there are often business threads working concurrently on the core application logic, and one or more reporting/observing threads which periodically sample the event counters incremented by the business threads.
Given the above use case, lets explore our options (or if you are the impatient kind skip to the summary and work your way backwards).

Atomic Mother: too much love

We can use AtomicLong, and for certain things it's a damn fine choice. Here's what happens when you count an event using AtomicLong (as of JDK7, see comments for JDK8 related discussion):
This is a typical CAS retry loop. To elaborate:

  1. Volatile read current value
  2. Increment
  3. Compare and swap current with new
  4. If we managed to swap, joy! else go back to 1
Now imagine lots of threads hitting this code, how will we suffer?
  • We could loop forever (in theory)!  
  • We are bound to experience the evil step sister of false sharing, which is real sharing. All writer threads are going to be contending on this memory location and thus one cache line and digging their heels until they get what they want. This will result is much cache coherency traffic.
  • We are using CAS (translates to lock cmpxchg on intel, read more here) which is a rather expensive instruction (see the wonderful Agner reference tables). This is much like a volatile write in essence.
But the above code also has advantages:
  • As it says on the tin, this is an atomic update of the underlying value. That value will go through each sequential value and will only continue execution once we ticked that value.
  • It follows that values returned by this method are unique.
  • The code is readable, the complex underside neatly cared for by the JMM(Java Memory Model) and a CAS.
There's nothing wrong with AtomicLong, but it seems like it gives us more than we asked for in this use case, and thus delivers less in the way of writer performance. This is your usual tradeoff of specialisation/generalisation vs performance. To gain performance we can focus our requirements a bit:
  1. Writer performance is more important than reader performance: We have many logic threads incrementing, they need to suffer as little as possible for the added reporting requirement.
  2. We don't require a read for each write, in fact we're happy with just incrementing the counters: We can live without the atomic joining of the inc and the get.
  3. We're willing to sacrifice the somewhat theoretical accuracy of the read value if it makes things better: I say theoretical because at the end of the day if you are incrementing this value millions of times per second you are not going to report on each value and if you try and capture the value non-atomically then the value reported is inherently inaccurate.
The above use case is in fact benchmarked in the Asymmetric example bundled with JMH. Running a variation with N writers and one reader we get the following (code is here):
AtomicCounterBenchmark.rw:get(N=1)  - 4.149 nsec/op
AtomicCounterBenchmark.rw:inc(N=1)  - 105.439 nsec/op

AtomicCounterBenchmark.rw:get(N=11) - 43.421 nsec/op
AtomicCounterBenchmark.rw:inc(N=11) - 748.520 nsec/op
AtomicCounterBenchmark.rw:get(N=23) - 115.268 nsec/op
AtomicCounterBenchmark.rw:inc(N=23) - 2122.446 nsec/op

Cry beloved writers! the reader pays nothing while our important business threads thrash about! If you are the sort of person who finds joy in visualising concurrent behaviour think of 11 top paid executives frantically fighting over a pen to fill in an expenses report to be read by some standards committee.

WARNING: Hacks & Benchmarks ahead!

In order to make the JDK8 classes used below run on JDK7 and in order to support some of my own code used below I had to run the benchmarks with my own Thread class. This led to the code included being a hack of the original JDK8 code. A further hack was required to make JMH load my thread factory instead of the one included in JMH. The JMH jar included is my hacked version and the changed class is included in the project as well. All in the name of experimentation and education...
The benchmarks were all run on an intel Xeon dual socket, 24 logical core machine. Because of the way JMH groups work (you have to specify the exact number of threads for asymmetric tests) I benchmarked on the above setup and did not bother going further(1/11/23 writers to 1 reader). I did not benchmark in situations were the number of threads exceeds the number of cores. Your mileage may wildly vary etc, etc, etc. The code is on GitHub as well as the results summary and notes on how the benchmarks were run.

The Long Adder

If ever there was a knight in shining armour for all things java concurrency it is Doug Lea, and Doug has a solution to the above problem coming to you in JDK 8 (or sooner if you want to grab it and use it now) in the form of LongAdder (extends Striped64). LongAdder serves the use case illustrated above by replacing the above increment logic with something a bit more involved:

Well... alot more involved really. 'Whatup Doug?' you must be asking yourself (I assume, maybe it makes instant sense to you, in which case shut up smart asses). Here's a quick break down:
Look! No contention!
  • LongAdder has a field called cells which is an array of Cells whose length is a power of 2, each Cell is a padded against false sharing volatile long (padding is counting on field order, they should probably have used inheritance to enforce that, like JMH's BlackHole). Kudos to Doug for the padded cells pun!
  • LongAdder has a field called base which is a volatile long (no padding here), 
  • if ((as = cells) != null || !casBase(b = base, b + x)) - Load the volatile cells field into a local variable. If it's not null keep going. If it is null try and CAS the locally read value of base with the incremented value. In other words, if we got no cells we give the old AtomicLong method a go. If there's no contention this is where it ends. If there is contention, the plot thickens...
  • So we've either hit contention now or before, our next step is to find our thread's hash, to be used to find our index in the cells array.
  • if (as == null || (n = as.length) < 1 || (a = as[(n - 1) & h]) == null || !(uncontended = a.cas(v = a.value, v + x))) - a big boolean expression, innit? let's elaborate:
    • as == null - as is the local cells copy, if it's null we ain't got no cells.
    • (m = as.length - 1) < 0 - we have a cells array, but it's empty. Compute mask while we're here.
    • (a = as[getProbe() & m]) == null - get the cell at our thread index (using the old mask trick to avoid modulo), check if it's null.
    • !(uncontended = a.cas(v = a.value, v + x)) - we got a cell and it's not null, try and CAS it's value to the new value.
  • So... we either have no cell for this thread, or we failed to increment the value for this thread, lets call longAccumulate(x, null, uncontended) where the plot thickens
If you thought the above was complex, longAccumulate will completely fry your noodle. Before I embark on explaining it, let us stop and admire the optimisations which go into each line of code above, in particular note the careful effort made to avoid redundant reads of any data external to the function and the need to cache locally all values of volatile reads.
So... what does longAccumulate do? The code explains itself:

Got it? Let's step through (I'm not going to do line by line for it, no time):
  • Probe is a new field on Thread, put there to support classes which require Thread id hashing. It's initialised/accessed via  ThreadLocalRandom and used by ForkJoin Pool and ConcurrentHashMap (This is JDK8, none of it happens yet in JDK7 land), getProbe is stealing it directly from Thread using Unsafe and field offset, cheeky! in my version I added a field to my CounterThread to support this.
  • If there's no array we create it. The cells array creation/replacement is a contention point shared between all threads, but should not happen often. We use cellsBusy as a spin lock. The cells array is sort of a copy on write array if you will, but the write spin lock is not the array, it's cellsBusy.
  • If there's no cell at our index we create one. We use cellsBusy to lock for writing to the table.
  • If we contend on the cell we expand the cells array, the array is only expanded if it's smaller than the number of available CPUs.
  • If CAS on the cell we have fails we modify our probe value in hope of hitting an empty/uncontended slot.
The above design (as I read it) is about compromise between contention, CPU cycles and memory. We could for instance simplify it by allocating all the cells upfront and set the number of cells upfront to the number of CPUs (nearest power of 2 >=  NCPU to be exact). But imagine this counter on a 128 CPU beast, we've just allocated 128 * (56 * 2 + 8 + change) bytes -> 14k for a counter that may or may not be contended. We pay for our frugal approach every time we hit contention between threads. On the plus side, every time we grow the cells array the likelihood of collision goes down. To further help things settle, threads will change cells to eventually find less contended cells if their probe value is an issue.
Here's a discussion between Doug and Nathan Raynolds on the merits of having per CPU counters which may help shed light on the design further. I got the feeling from reading it that the cells are an abstraction of the CPU counters, and given no facility in the language to discover processor ID on the fly it seems like a good approach. Doug also mentions @Contended as a means to replace the manual padding, which is probably on it's way.
I can think of 2 ways to improve the above slightly:
  1. Use an array of longs instead of cells, padding by leaving slots of the array empty. This is essentially the approach taken by Cliff Click here: ConcurrentAutoTable (One reviewer pointed out the CAT vs Doug pun...). This should reduce the space requirement (only need half the padding) and will inline the values in the array (one less pointer to chase). If we had value type/structs array support in Java we would need this. The even stride in memory should also improve the read performance.
  2. Under the assumption of cells correctly reflecting the CPU affinity of threads we could co-host counters in the same cell. Of-course if the same cell is hit from several processors we've just re-introduced false sharing :(... maybe hold off on that one until we have processor ID.
Assuming all threads settle on top of their respective CPUs and no contention happens, this implementation is still bound by doing volatile writes and the logistics surrounding the cell acquisition.
How does it perform (benchmark code is here)?
LongAdderCounterBenchmark.rw:get(N=1)  - 10.600 nsec/op
LongAdderCounterBenchmark.rw:inc(N=1)  - 249.703 nsec/op
LongAdderCounterBenchmark.rw:get(N=11) - 752.561 nsec/op
LongAdderCounterBenchmark.rw:inc(N=11) - 44.696 nsec/op
LongAdderCounterBenchmark.rw:get(N=23) - 1380.936 nsec/op
LongAdderCounterBenchmark.rw:inc(N=23) - 38.209 nsec/op

Nice! low cost updates and high (but acceptable) read cost. This better reflects our use case, and if your are implementing performance counters in your application you should definitely consider using a back ported LongAdder. This is the approach taken in in Yammer Metrics project. Their Counter holds a back ported LongAdder whose performance is (code here):
LongAdderBackPortedCounterBenchmark.rw:get(N=1)  - 5.854 nsec/op
LongAdderBackPortedCounterBenchmark.rw:inc(N=1)  - 192.414 nsec/op
LongAdderBackPortedCounterBenchmark.rw:get(N=11) - 704.011 nsec/op
LongAdderBackPortedCounterBenchmark.rw:inc(N=11) - 40.886 nsec/op
LongAdderBackPortedCounterBenchmark.rw:get(N=23) - 1188.589 nsec/op
LongAdderBackPortedCounterBenchmark.rw:inc(N=23) - 38.309 nsec/op

Perhaps because of the changes between the 2 versions, or because LongAdder was designed to run on a JDK8 VM the results favour the backport over the JDK8 version when running on a JDK7 install. Note that the 1 writer/reader case performs badly, far worse than AtomicLong. On the high contention path this reverts to expected behaviour.

For completeness I tested how Cliff's CAT (I took the code from the link provided earlier) performs (here's the benchmark). CAT has a nice _sum_cache field which is used to avoid reading the table if it has not been invalidated. This saves the reader alot of work at theoretically little cost for the writers. The results I got running the benchmark varied wildly with get() looking great when inc() wasn't and get() performing very badly when inc() performs superbly. I suspect the shortcut above to be at the heart of this instability, but have not had time to get to the root of it. I exclude the results as they varied too wildly from run to run to be helpful.

Why Should You Care?

Why indeed? Why are Doug and Cliff worried? if you've watched the Future Of The VM talk featuring those very same dudes, you'd have noticed the future has many many many CPUs in it. And if we don't want to hit a wall with our data structures which worked so well back when we had only 4 CPUs to worry about then we need to get cracking on writing some mighty parallel code :-)
And if it turns out your performance counters are in fact the very reason you can't perform, wouldn't that be embracing? We need to be able to track our systems vital stats without crippling these systems, here is a paper from Mr. Dave Dice (follow his blog, great stuff) and friends looking at scalable performance counters. Let me summarise for my more lazy readers:
  • "commonly-used naive concurrent implementations quickly become problematic, especially as thread counts grow, and as they are used in increasingly Non-Uniform Memory Access (NUMA) systems." - The introduction goes on to explore AtomicLong type counters and non-threadsafe hacks which lose updates. Both are unacceptable. Using LOCK ADD  will not save you - "Experiments confirm our intuition that they do not adequately addresses the shortcomings of the commonly used naive counters. "
  • Section 2.1 "Minimal Space Overhead" while interesting is not really an option for a Java hacker as it requires us to know which NUMA node we are on. In future, when processor ID is available to us we may want to go back to that one. Further more conflicts are resolved by letting updaters wait.
  • Section 2.2 "Using A little More Space" outlines something similar to LongAdder above, but again using NUMA node IDs to find the slot and contend locally on it. It then boils down to these implementations - "suffer under high contention levels because of contention between threads on the same node using a single component." - not surprising given that a NUMA node can have 12 logical cores or more hitting that same component, CASing away.
  • "won't be nothing you can't measure anymore"
  • Section 3 onward are damn fascinating, but are well beyond the scope of this humble post. Dice and friends go on to explore statistical counters which using fancy maths reduce the update rate while maintaining accuracy. If you find 'fancy maths' unsatisfying, JUST READ IT!!! The end approach is a combination of statistical counters and the original LongAdder style counters. It is balancing CPU cycles vs. the cost of contention for the sake of memory efficiency and finding the right balance.
The reason I mention this article is to highlight the validity of the use case. Writes MUST be cheap, reads are less of a worry. The more cores are involved, the more critical this issue becomes. The future, and in many ways the present on the server side, is massively parallel environments. We still need counters in these environments, and they must perform. Can we get better performance if we were to give up some of the features offered by LongAdder?

TLC: Love does not stand sharing

What the LongAdder is trying to avoid, and the above article is side stepping as a viable option, is having a counter copy per thread. If we could have ProcessorLocal counters then that would probably be as far as we need to go, but in the absence of that option should we not consider per thread counters? The down side as one would expect is memory consumption, but if we were to off-balance the padding against the duplicates then there are use cases where per thread counters may prove more memory efficient. The up side is that we need not worry about contention, and can replace the costly CAS with the cheap lazySet (see previous post on the topic). Even if we pad, there are ways to minimize the padding such that all counters share a given thread's padding. If you work in an environment where you typically have fixed sized thread pools executing particular tasks, and performance is critical to what you do then this approach might be a good fit.
The simplest approach is to use ThreadLocal as a lookup for the current thread view of the shared counter and have get() sum up the different thread copies. This ThreadLocalCounter (with padding) scales surprisingly well:
ThreadLocalCounterBenchmark.rw:get(N=1)  - 61.563 nsec/op
ThreadLocalCounterBenchmark.rw:inc(N=1)  - 15.138 nsec/op
ThreadLocalCounterBenchmark.rw:get(N=11) - 725.532 nsec/op
ThreadLocalCounterBenchmark.rw:inc(N=11) - 12.898 nsec/op
ThreadLocalCounterBenchmark.rw:get(N=23) - 1584.209 nsec/op
ThreadLocalCounterBenchmark.rw:inc(N=23) - 16.384 nsec/op

A room of one's own
There are minor details worth considering here such as how ThreadLocal copies are added to the pool of counters and how to deal with dead threads. While joining is easily done via ThreadLocal.initialValue, there is sadly no cleanup callback to utilise on on Thread termination which means dead counters can collect in the pool. In an environment in which threads live short and careless lives only to be replaced by equally foolish threads this approach will not scale as counters are left stuck in the array. A simple solution here is to have the pool check for dead counters when new threads join. Counters may still be left in the pool long after the Thread died, but it will do a rudimentary check for leftovers on each thread added. Another solution is to do the check on each get(), but this will drive the cost of get() up. Yet another approach is to use WeakReferences to determine counters dropping off. Pick whichever suits you, you could even check on each get if it's seldom enough. This post is getting quite long as is so I'll skip the code, but here it is if you want to read it.
For all it's simplicity the above code delivers a triple the performance of LongAdder for writers at the cost of allocating counters per thread. With no contention LongAdder will deliver the cost of a single AtomicLong, but TLC will cost the same. The get() performance is similar to LongAdder, but note that contended or not the get() performance of the TLC is constant and gets worse with every thread added, where the LongAdder will only deteriorate with contention, and only up to the number of CPUs.

Become a member today!

A more specific solution requires us to add a counter field to our thread. This saves us the lookup cost, but may still leave us exposed to false sharing should our thread field be updated from other thread (read this concurrency-interest debate on making Thread @Contended). Here's how this one performs (benchmark is here):
ThreadFieldCounterBenchmark.rw:get(N=1)  - 25.264 nsec/op
ThreadFieldCounterBenchmark.rw:inc(N=1)  - 3.723 nsec/op
ThreadFieldCounterBenchmark.rw:get(N=11) - 483.723 nsec/op
ThreadFieldCounterBenchmark.rw:inc(N=11) - 3.177 nsec/op
ThreadFieldCounterBenchmark.rw:get(N=23) - 952.433 nsec/op
ThreadFieldCounterBenchmark.rw:inc(N=23) - 3.045 nsec/op

This is 10 times faster than LongAdder on the inc(), and 700 times faster than AtomicLong when the shit hits the fan. If you are truly concerned about performance to such an extreme this may be the way to go. In fact this is exactly why ThreadLocalRandom is implemented using a field on Thread in JDK8.
A cooking pun!
Now, cooking your own Thread classes is certainly not something you can rely on in every environment. Still it may prove an interesting option for those with more control over their execution environments. If you are at liberty to add one field, just bunch the lot with no padding between them on your thread and pad the tail to be safe. As they are all written to from the same thread there is no contention to worry about and you may end up using less space than the LongAdder.

Summary

For all counters results reflect 1/11/23 writers busily updating a counter while a single reader thread reads:

  • AtomicLong -> One counter for all threads -> fast get(4ns/43ns/115ns) but slow inc(105ns/748ns/2122ns). inc() is slower as contention grows. Least memory required. 
  • LongAdder -> A table of counters -> slow get(10ns/752ns/1380ns) but faster inc(105ns/40ns/38ns). get() is slower as contention grows, inc() is slow when no cells are present, but settles on a fast figure once it gets going. Memory consumption increases with contention, but little overhead for no contention. Cells are padded so increase has 122b overhead. 
  • ThreadLocalCounter -> Every thread has a counter in it's ThreadLocal map -> slow get(61ns/725ns/1584ns) but even faster inc(15ns/12ns/16ns). get() is slower as the number of threads grow, inc() is pretty contant and low cost. Memory consumption increases with every thread added, regardless of contention. Counters are padded so each has 122b overhead. It is suggested you use a shared counters class to amortise the padding cost.
  • ThreadFieldCounter -> Every thread has a counter field -> get(25ns/483ns/952ns) is slower than AtomicLong, but better than the rest. The fastest inc(4ns/3ns/3ns). get() is slower as the number of threads grow, inc() is contant and low cost. Memory consumption increases with every thread added, regardless of contention. Counters are not padded but you may want to pad them.

I believe that for certain environments the counter per thread approach may prove a good fit. Furthermore for highly contended counters, where LongAdder/similar will expand I believe that this approach can be extended to provide a more memory efficient alternative when the thread sets are fixed or limited and a group of counters is required rather then just one counter.

UPDATE (1/08/2013): If you are looking for more JMH related info, see Shipilev's slides from JVMLS.