Sunday, 15 September 2013

Diving Deeper into Cache Coherency

I recently gave a talk about Mechnical Sympathy at Facebook, which was mostly a look at the topic through the SPSC queue optimization series of posts. During the talk I presented the optimisation step (taken in Martin's original series of queue implementations) of adding a cache field for the head and tail. Moving from this:

To this:


This change yields a great improvement in throughput which I explained to be down to the reduction in coherency traffic between the cores. This is:
  1. Not what I stated previously here.
  2. A very brief and unsatisfying explanation.
I shall try and remedy that in this post.


Penance

In my original step by step post I explained the benefit of the above optimization is the replacement of a volatile read with a plain read. Martin was kind enough to gently correct me in the comments:
"The "volatile read" is not so much the issue. The real issues come from the read of the head or tail from the opposite end will pretty much always result in a cache miss. This is because the other side is constantly changing it."
and I argued back, stating the JIT compiler can hoist the field into a register and wistfully wishing I could come up with an experiment to prove one way or the other.  I was mostly wrong and Martin was totally right. 
I say mostly and not entirely because eliminating volatile reads is not a bad optimization and is responsible for part of the perf improvement. But it is not the lion share. To prove this point I have hacked the original version to introduce volatile reads (but still plain writes) from the headCache/tailCache fields. I won't bore you with the code, it's using the field offset and Unsafe.getLongVolatile to do it.
I ran the test cross core for 30 times and averaged the summary results. Running on new hardware (so no reference point to prev. quoted results) i7-4700MQ/Ubuntu 13.04/JDK7u25. Here are the results, comparing Original21 (head/tail padded, no cache fields), Original3 (head/tail padded, head/tailCache padded) and VolatileRead (same as Original3, but with volatile read of cache fields):

Original21:     65M ops/sec
Original3:     215M ops/sec
VolatileRead:  198M ops/sec

As we can see, there is no massive difference between Original3 and VolatileRead (especially when considering the difference from Original21), leading me to accept I need to buy Martin a beer, and apologize to any reader of this blog who got the wrong idea reading my post.
Exercise to the reader: I was going to run the above with perf to quantify the impact on cache-misses, but as perf doesn't support this functionality on Haswell I had to let it go. If someone cares to go through the exercise and post a comment it would be most welcome.


What mean cache coherency?

Moving right along, now that we accept the volatile read reduction is not the significant optimization here, let us dig deeper into this cache coherency traffic business. I'll avoid repeating what is well covered elsewhere (like cache-coherence, or MESIF on wikipedia, or this paper, some excellent examples here, and an animation for windows users only here) and summarize:
MESI State Diagram
  • Modern CPUs employ a set of caches to improve memory access latency.
  • To present us with a consistent view of the world when concurrent access to memory happens the caches must communicate to give us a coherent state.
  • There are variations on the protocol used. MESI is the basic one. Recent intels use MESIF. In the examples below I use MESI as the added state in MESIF adds nothing to the use case.
  • The guarantee they go for is basic:
    • One change at a time (to a cache line): A line is never in M state in more than one place. 
    • Let me know if I need a new copy: If I have a copy and someone else changed it I need to get me a new copy. (My copy will move from Shared to Invalid)
All of this happens under the hood of your CPU without you needing to lose any sleep, but if we somehow cause massive amounts of cache coherency traffic then our performance will suffer. One note about the state diagram. The observant reader (thanks Darach) will notice the I to E transition for Processor Write(PW) is in red. This is not my diagram, but I think the reason behind it is that the transition is very far from trivial (or a right pain in the arse really) as demonstrated below.


False Sharing (once more)

False sharing is a manifestation of this issue where 2 threads are competing to write to the same cache line which is constantly Invalid in their own cache.

Here's a blow by blow account of false sharing in terms of cache coherency traffic:
  1. Thread1 and Thread2 both have the false Shared cache line in their cache
  2. Thread1 modifies HEAD (state goes from S to E), Thread2's copy is now Invalid
  3. Thread2 wants to modify TAIL but his cache line is now in state I, so experiences a write miss:
    1. Issue a Read With Intent To Modify (RWITM)
    2. RWITM intercepted by Thread1
    3. Thread1 Invalidates own copy
    4. Thread1 writes line to memory
    5. Thread2 re-issues RWITM which results in read from memory (or next layer cache)
  4. Thread1 wants to write to HEAD :( same song and dance again, the above gets in it's way etc.

The diagram to the right is mine, note the numbers on the left track the explanation and the idea was to show the cache lines as they mutate on a timeline. Hope it helps :-).


Reducing Read Misses

So False Sharing is really bad, but this is not about False Sharing (for a change). The principal is similar though. With False Sharing we get Write/Read misses, the above manoeuvre is about eliminating Read misses. This is what happens without the HEADC/TAILC fields (C for cache):
  1. Thread1 and Thread2 both have the HEAD/TAIL  cache lines in Shared state in their cache
  2. Thread1 modifies HEAD (state goes from S to E), Thread2's copy is now Invalid
  3. Thread2 wants to read HEAD to check if the queue wrapped, experiences a Read Miss:
    1. Thread2 issues a request for the HEAD cache line
    2. Read is picked up by Thread1
    3. Thread1 delivers the HEAD cache line to Thread2, the request to memory is dropped
    4. The cache line is written out to main memory and now Thread1/2 have the line in Shared state
This is not as bad as before, but is still far from ideal. The thing is we don't need the latest value of HEAD/TAIL to make progress, it's enough to know that the next increment to our counter is available to be used. So in this use case, caching the head/tail gives us a great win by avoiding all of these Read Misses, we only hit the Read Miss when we run out of progress to be made against our cached values. This looks very different:
  1. Thread1 and Thread2 both have the HEAD/TAIL/HEADC/TAILC  cache lines in Shared state in their cache (the TAILC is only in Thread1, HEADC is only in Thread2, but for symmetry they are included).
  2. Thread1 reads TAILC and modifies HEAD (state goes from S to E), Thread2's copy is now Invalid.
  3. Thread2 reads from HEADC which is not changed. If TAIL is less than HEADC we can make progress (offer elements) with no further delay. This continues until TAIL is equal to HEADC. As long as this is the case HEAD is not read, leaving it in state M in Thread1's cache. Similarly TAIL is kept in state M and Thread2 can make progress. This is when we get the great performance boost as the threads stay out of each others way.
  4. Thread1 now needs to read TAIL to check if the queue wrapped, experiences a Read Miss:
    1. Thread1 issues a request for the TAIL cache line
    2. Request is picked up by Thread2
    3. Thread2 delivers the TAIL cache line to Thread1, the request to memory is dropped
    4. The cache line is written out to main memory and now Thread1/2 have the line in Shared state
    5. TAIL is written to TAILC (TAILC line is now E)
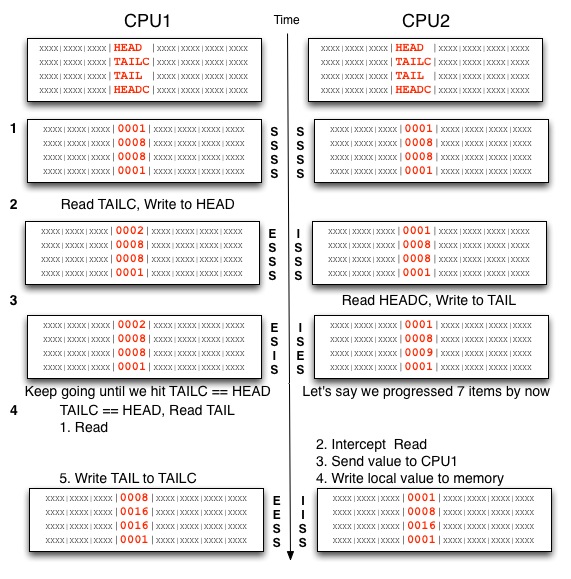
The important thing is that we spend most of our time not needing the latest HEAD value which means Thread2 is not experiencing as many Read Misses, with the added benefit of the threads not having to go back and forth from Shared to Exclusive/Modified state on writes. Once I have a line in the M state I can just keep modifying with no need for any coherence traffic. Also note we never experience a Write Miss.


Summary

In an ideal application (from a cache coherency performance POV) threads never/rarely hit a read or write miss. This translates to having single writers to any piece of data, and minimizing reads to any external data which may be rapidly changing. When we are able to achieve this state we are truly bound by our CPU (rather than memory access).
The takeaway here is: Fast moving data should be in M state as much as possible. A read/write miss by any other thread competing for that line will lead to reverting to S/I which can have significant performance implications. The above example demonstrates how this can achieved by caching stale but usable copies locally to another thread.

Tuesday, 6 August 2013

JMM Cookbook Footnote: NOOP Memory Barriers on x86 are NOT FREE

In Doug Lea's excellent JMM Cookbook the following observation is made about memory barriers on different architectures:
Processor LoadStore LoadLoad StoreStore StoreLoad Data
dependency
orders loads?
Atomic
Conditional
Other
Atomics
Atomics
provide
barrier?
sparc-TSO no-op no-op no-op membar (StoreLoad) yes CAS: casa swap,ldstub full
x86 no-op no-op no-op mfence or
cpuid or
locked insn
yes CAS:
cmpxchg
xchg,
locked insn
full
ia64 combine
with

st.rel or
ld.acq
ld.acq st.rel mf yes CAS:
cmpxchg
xchg,
fetchadd
target +
acq/rel
arm dmb
(see below)
dmb
(see below)
dmb-st dmb indirection
only
LL/SC:
ldrex/strex

target
only
This leads quite a few people to conclude that there is no performance cost to the memory barriers that are marked no-op, and on occasion leads people to believe they can just not put them in at all. After all, what is the point in a no-op? surely a program with the no-ops removed is the same program, right? Wrong...
After having this debate again recently I thought I'd document it here to avoid repetition, and to get some second opinions I got some help from the good people on the concurrency-interest mailing list.

What's a Memory Barrier?

This is Noop
From the Cookbook:
"Compilers and processors must both obey reordering rules. No particular effort is required to ensure that uniprocessors maintain proper ordering, since they all guarantee "as-if-sequential" consistency. But on multiprocessors, guaranteeing conformance often requires emitting barrier instructions...
...Memory barrier instructions directly control only the interaction of a CPU with its cache, with its write-buffer that holds stores waiting to be flushed to memory, and/or its buffer of waiting loads or speculatively executed instructions."
We need memory barriers to help the compiler and CPU make sense of our intentions in terms of concurrency. We need to hold them back from optimizing away code that can be eliminated or re-ordered if optimal single threaded execution is the only consideration. The last bit suggests that barriers are really about memory ordering.

Why isn't it free?

Volatile reads (LoadLoad) and lazySet/putOrdered (StoreStore) are both "No-op"s on x86. Mike Barker (LMAX dude, maintainer and contributor to the Disruptor, here's his blog) replied to my request for clarification:
"The place to look (as definitive as it gets for the hardware) is section 8.2.2, volume 3A of the Intel programmer manual.  It lists the rules that are applied regarding the reordering of instructions under the X86 memory model.  I've summarised the relevant ones here:
- Reads are not reordered with other reads.
- Writes are not reordered with older reads.
- Writes to memory are not reordered with other writes.
- Reads may be reordered with older writes to different locations but not with older writes to the same location.
The only reordering that will occur with x86 is allowing reads to be executed before writes (to other locations), hence the need for a LOCKed instruction to enforce the store/load barrier.  As you can see with the above rules, store are not reordered with older stores and loads are not reordered with older loads so a series of MOV instructions is sufficient for a store/store or a load/load barrier."
So since a volatile read and a lazySet both boil down to a MOV from/to memory, no further special instruction is required (hence no-op) as the underlying architecture memory model obeys the rules required by the JMM (Note: lazySet is not in the JMM, but is as good as in it, I go into the origins of lazySet here). But while that does mean these barriers are cheap it doesn't make them free. The above rules Mike is quoting are for the generated assembly, but the barriers impact the compiler as well. Memory barriers are there to stop your code being interpreted a particular way by both the compiler and the CPU. The JMM guarantees that memory barriers are respected by BOTH. This is important because the JMM Cookbook is talking about CPU no-ops, not compiler no-ops. Vitaly Davidovich from concurrency interest replied:
"Yes, volatile loads and lazySet do not cause any cpu fence/barrier instructions to be generated - in that sense, they're noop at the hardware level.  However, they are also compiler barriers, which is where the "cheap but ain't free" phrase may apply. The compiler cannot reorder these instructions in ways that violate their documented/spec'd memory ordering effects. So for example, a plain store followed by lazySet cannot actually be moved after the lazySet; whereas if you have two plain stores, the compiler can technically reorder them as it sees fit (if we look at just them two and disregard other surrounding code). So, it may happen that compiler cannot do certain code motion/optimizations due to these compiler fences and therefore you have some penalty vs using plain load and stores.  For volatile loads, compiler cannot enregister the value like it would with plain load, but even this may not have noticeable perf diff if the data is in L1 dcache, for example."
The difference in performance between using a plain write and a lazySet has been demonstrated in this post if you look at the difference between the putOrdered and plain writes versions. I expect this difference is far more pronounced in a benchmark than in a full blown system, but the point is it's a demonstrable difference. Similarly here Mr. Brooker demonstrates there is a difference between normal reads and volatile reads. There's a flaw in the experiment in that the volatile writes are making the volatile reads slower, but his point is valid as a demonstration of inhibited optimization (loop is not unrolled, value is not enregistered) and the uncontended read tells that story well.

So... I can't just drop it out of my program?

The TSO model for x86 dictates how your code will behave, if you were writing assembly. If you are writing Java, you are at the mercy of the JIT compiler first, and only then the CPU. If you fail to inform the compiler about your intentions, your instructions may never hit the CPU, or may get there out of order. Your contract is with the JMM first.
It's like punctuation: "helping your uncle Jack off a horse" != "helping your uncle jack off a horse" => punctuation is not a no-op ;-)

Monday, 29 July 2013

Atomicity of Unaligned Memory Access in Java

This is an attempt to clarify and improve on previous statements I've made here (and before that here) on unaligned memory access and it's implications. Let's start from the top:
  1. Unaligned access is reading/writing a short/int/long from/to an address that is not divisible by it's size.
  2. Unaligned access to data on the heap is not possible without using sun.misc.Unsafe.
  3. Unaligned access to data off the heap is possible via direct ByteBuffer.
  4. Unaligned access to data is very possible using unsafe both on/off heap.
  5. Unaligned access is therefore bad news even for good boys and girls using direct ByteBuffer, as the result on unaligned access are architecture/OS specific. You may find that your code crashes inexplicably on some processes when running some OSs.
  6. Unaligned access atomicity pure and simple is not a JVM issue. You can only "legally" do it by using direct ByteBuffer, and that is explicitly not a thread safe object so you are in no position to expect atomicity (As an aside, in heap ByteBuffers all writes are not atomic)
  7. What happens on unaligned access stays on unaligned access ;-)
So unaligned access is a problem for the few, and concurrent unaligned access is a problem for naughty, tricksy hobbitses who want to play with matches. Such devils may want to write an IPC, or use off heap memory to store structs, and are hoping to get coherent results. Here's my results thus far for x86 processors. Skip to the summary at the end if you don't care for the journey.

Unaligned access within the cache line

Unaligned access within the cache line is not atomic on older Intel processors, but is atomic on later models (from the intel developer manual under 8.1.1 Guaranteed Atomic Operations): 
"The P6 family processors (and newer processors since) guarantee that the following additional memory operation will always be carried out atomically: 
  • Unaligned 16-, 32-, and 64-bit accesses to cached memory that fit within a cache line"
To demonstrate this time around I'll use a simpler means than JCStress and just roll my own, the same tests are available on my fork of JCStress here. The same test will be used for the cross line test, and it covers all 3 flavours of visible writes (ordered/volatile,CAS):
We expect the test to run forever (or as long as we need to feel comfortable) if the writes are atomic. If they are not we expect the test to write "WTF" and exit early. Running the test for all write variations with an offset of 12 leads to no breakage of atomicity when run on a Core2Duo and Xeon, this test should break (i.e exit early, WTF) on older processors and this result has been confirmed to indeed happen.
So far so good, unaligned access is confirmed atomic on recent Intel processors and the evidence supports the documentation.


Unaligned access across the cache line

Crossing the cache line falls outside the scope of the prev. statement quoted so is not atomic unless we use the LOCK instruction (see under 8.1.2.2 Software Controlled Bus Locking):
"The integrity of a bus lock is not affected by the alignment of the memory field. The LOCK semantics are followed for as many bus cycles as necessary to update the entire operand. However, it is recommend that locked accesses be aligned on their natural boundaries for better system performance... Locked operations are atomic with respect to all other memory operations and all externally visible events."
Cool, so... which one is locked? One way to find out is run the test, so I did.... and... it looks like none...
So nothing is locked? that seemed wrong.
Certainly CAS is locked. CAS translates directly into LOCK CMPXCHG, so definitely locked, and yet the experiment definitely fails. This is as far as I got with JCStress, and this result raised some eyebrows. Re-reading through the code I wrote for JCStress didn't raise any suspicion, so I wrote a variation of the above test and still it looked like the CAS values are broken.
I have to admit I was happy to leave it at that, and in some ways it is not a wrong conclusion, but I met with some insistent doubt from Mr. Gil Tene of Azul. With both Gil and the Intel manual insisting this is not right I had a final go at cracking this contradiction and read through the assembly. The CAS writes are indeed as expected LOCK CMPXCHG, but the volatile read is:
  0x0000000106b5d60c: movabs r10,0x7f92a38248fc
  0x0000000106b5d616: mov    r10,QWORD PTR [r10]  ;*invokevirtual getLongVolatile
A MOV with no lock! So it is perhaps not the CAS that is broken, it is the volatile read. To prove the point I change the test for broken values to be:

And indeed, with this version CAS is proved to never deliver broken values, CAS is atomic across the cache line. But... as far as Java is concerned, this is only of use if you want to use CAS to test for the written values, which is not that useful. This highlights the fact that while CAS is implemented using LOCK CMPXCHG, it does not have the same interface. CMPXCHG returns the current value even on failure. That would have been exactly what we'd want to replace the volatile read in this particular and admittedly perverse case.
Now with the new atomic observation we can re-examine the atomicity of the ordered and volatile writers. And find, to our shared joy/sorrow that they are just as broken as before. The ordered write should come as no surprise as it is a plain MOV, but the volatile write is a bit surprising (to me if not to others. Gil for instance wasn't surprised, the clever bastard). It's a close call thing, you could implement a volatile write using a single locked instruction (LOCK XCHG), but the actual implementation is via a MOV followed by a LOCK ADD (see end of Martin's post and comments for discussion on that implementation choice). As things currently stand, cache line crossing volatile writes are not atomic.

Summary & Credits

Rules of unalignment thus far are:
  1. If you can at all help it, read and write aligned data.
  2. Unaligned writes and reads within the cache line are atomic on recent Intel processors, but not atomic on older models.
  3. Unaligned writes and reads across the cache line are not atomic unless they are locked.
  4. Of the available options, only CAS is locked. There is no locked way to read an arbitrary value.
  5. Volatile/Ordered writes are not atomic, volatile read is also not atomic.
The above is true for Intel x86, but I would not expect other processors to behave the same.
This post is really a summary of the combined efforts and ideas by Gil, Martin (thanks guys) and myself. Any errors are in all probability mine, please let me know if you find any. The test code is here, you can run with any offset, write type or read type by playing with the system properties, have a play and let me know your results. I'm particularly curious to hear from anyone running on non-intel processors who can share their results.

Wednesday, 24 July 2013

Java Concurrency Torture Update: Don't Stress

A piece of late news: the concurrency suite is back. And so is my little test on top of it.
A few months ago I posted on yet another piece of joyful brilliance crafted by Master Shipilev, the java-concurrency-suite. I used the same framework to demonstrate some valid concerns regarding unaligned access to memory, remember children:
  • Unaligned access is not atomic
  • Unaligned access is potentially slow, in particular:
    • On older processors
    • If you cross the cache line
  • Unaligned access can lead to SEG_FAULT on non-intel architectures, and the result of that might be severe performance hit or your process crashing...
It was so much fun that someone had to put a stop to it, and indeed they did.
The java-concurrency-suite had to be removed from github, and the Master Inquisitor asked me to stop fucking around and remove my fork too, if it's not too much trouble... so I did.
Time flew by and at some point the powers that be decided the tool can return, but torture was too much of a strong word for those corporate types and so it has been rebranded JCStress. JC is nothing to do with the Jewish Community, as some might assume, it is the same Java Concurrency but now it's not torture (it's sanctioned after all), it's stress. Aleksey is simply stressing your JVM, he is not being excessively and creatively sadistic, that would be too much!
Following the article I had a short discussion with Mr T and Gil T with regards to unaligned access in the comments to Martin's blog post on off-heap tuple like storage. The full conversation is long, so I won't bore you, but the questions asked were:
  1. Is unaligned access a performance only, or also a correctness issue?
  2. Are 'volatile' write/reads safer than normal writes/reads?
The answers to the best of my understanding are:
  1. Unaligned access is not atomic[Correction 23/09/2013: On later Intel processor unaligned access within the cache line is atomic, but access across the line is not. See update below and related later post], and therefore can lead to the sort of trouble you will not usually experience in your programs (i.e half written long/int/short values). This is a problem even if you use memory barriers correctly. It adds a 'happened-badly' eventuality to the usual happens before/after reasoning and special care must be taken to not get slapped in the face with a telephone pole.
  2. Volatile read/writes are NOT special. In particular doing a CAS[Correction 23/09/2013: CAS is atomic, all others are not. See update below and related later post]/putOrdered/putVolatile write to an unaligned location such that the value is written across the cache line is NOT ATOMIC.
This came up in a discussion recently, which prompted me to go and fork JCStress on to bitbucket and rerun the experiments on both a Core2Duo and a Xeon processor and re-confirmed the result. This is a problem for folks considering the Atomics for ByteBuffer suggestion discussed on the concurrency-interest mailing list. There is nothing in the ByteBuffer interface to stop you from doing unaligned access...

UPDATE (1/08/2013): Shipilev's slides from JVMLS lightning talk.

UPDATE (23/09/2013): I've discussed the issue further with Gil and Martin, which led to the following post. Some corrections to the above observations have been made which I now inlined above.

Tuesday, 23 July 2013

SPSC Revisited - part II: Floating vs Inlined Counters


{This post is part of a long running series on lock free queues, checkout the full index to get more context here}
Continued from here, we examine the comparative performance of 2 approaches to implementing queue counters.
If we trace back through the journey we've made with our humble SPSC queue you'll note a structural back and forth has happened. In the first post, the first version had the following layout (produced using the excellent java-object-layout tool):
uk.co.real_logic.queues.P1C1QueueOriginal1
 offset  size     type description
      0    12          (assumed to be the object header + first field alignment)
     12     4 Object[] P1C1QueueOriginal1.buffer
     16     8     long P1C1QueueOriginal1.tail
     24     8     long P1C1QueueOriginal1.head
     32                (object boundary, size estimate)
We went on to explore various optimisations which were driven by our desire to:
  1. Replace volatile writes with lazySet
  2. Reduce false sharing of hot fields
To achieve these we ended up extracting the head/tail counters into their own objects and the layout turned to this:
uk.co.real_logic.queues.P1C1QueueOriginal3
 offset  size       type description
      0    12            (assumed to be the object header + first field alignment)
     12     4        int P1C1QueueOriginal3.capacity
     16     4        int P1C1QueueOriginal3.mask
     20     4   Object[] P1C1QueueOriginal3.buffer
     24     4 AtomicLong P1C1QueueOriginal3.tail
     28     4 AtomicLong P1C1QueueOriginal3.head
     32     4 PaddedLong P1C1QueueOriginal3.tailCache
     36     4 PaddedLong P1C1QueueOriginal3.headCache
     40                  (object boundary, size estimate)
But that is not the whole picture, we now had 4 new objects (2 of each class below) referred from the above object:
uk.co.real_logic.queues.P1C1QueueOriginal3$PaddedLong
 offset  size type description
      0    12      (assumed to be the object header + first field alignment)
     12     4      (alignment/padding gap)
     16     8 long PaddedLong.value
     24-64  8 long PaddedLong.p1-p6
     72            (object boundary, size estimate)
 
uk.co.real_logic.queues.PaddedAtomicLong
 offset  size type description
      0    12      (assumed to be the object header + first field alignment)
     12     4      (alignment/padding gap)
     16     8 long AtomicLong.value
     24-64  8 long PaddedAtomicLong.p1-p6
     72            (object boundary, size estimate)
These counters are different from the original because they are padded (on one side at least), but also they represent a different overall memory layout/access pattern. The counters are now floating. They can get relocated at the whim of the JVM. Given these are in all probability long lived objects I
wouldn't think they move much after a few collections, but each collection presents a new opportunity to shuffle them about.
In my last post I explored 2 directions at once:
  1. I fixed all the remaining false-sharing potential by padding the counters, the class itself and the data in the array.
  2. I inlined the counters back into the queue class, in a way returning to the original layout (with all the trimmings we added later), but with more padding.
I ended up with the following layout:
psy.lob.saw.queues.spsc4.SPSCQueue4
 offset  size     type description
      0    12          (assumed to be the object header + first field alignment)
     12     4          (alignment/padding gap)
     16-72  8     long L0Pad.p00-07
     80     4      int ColdFields.capacity
     84     4      int ColdFields.mask
     88     4 Object[] ColdFields.buffer
     92     4          (alignment/padding gap)
     96-144 8     long L1Pad.p10-16
    152     8     long TailField.tail
    160-208 8     long L2Pad.p20-26
    216     8     long HeadCache.headCache
    224-272 8     long L3Pad.p30-36
    280     8     long HeadField.head
    288-336 8     long L4Pad.p40-46
    344     8     long TailCache.tailCache
    352-400 8     long L5Pad.p50-56
    408                (object boundary, size estimate)
This worked well, reducing run to run variance almost completely and delivering good performance. The problem was it was failing to hit the highs of the original implementation and variants, particularly when running across cores.
To further explore the difference between the inlined and floating versions I went back and applied the full padding treatment to the floating counters version. This meant replacing PaddedLong and PaddedAtomicLong with fully padded implementations, adding padding around the class fields and padding the data. The full code is here, it's very similar to what we've done to pad the other classes. The end result has the following layout:
psy.lob.saw.queues.spsc.fc.SPSPQueueFloatingCounters4
 offset  size             type description
      0    12                  (assumed to be the object header + first field alignment)
     12     4                  (alignment/padding gap)
     16-72  8             long SPSPQueueFloatingCounters4P0.p00-p07
     80     4              int SPSPQueueFloatingCounters4Fields.capacity
     84     4              int SPSPQueueFloatingCounters4Fields.mask
     88     4         Object[] SPSPQueueFloatingCounters4Fields.buffer
     92     4 VolatileLongCell SPSPQueueFloatingCounters4Fields.tail
     96     4 VolatileLongCell SPSPQueueFloatingCounters4Fields.head
    100     4         LongCell SPSPQueueFloatingCounters4Fields.tailCache
    104     4         LongCell SPSPQueueFloatingCounters4Fields.headCache
    108     4                  (alignment/padding gap)
    112-168 8             long SPSPQueueFloatingCounters4.p10-p17
    176                        (object boundary, size estimate)

psy.lob.saw.queues.spsc.fc.LongCell
 offset  size type description
      0    12      (assumed to be the object header + first field alignment)
     12     4      (alignment/padding gap)
     16-64  8 long LongCellP0.p0-p6
     72     8 long LongCellValue.value
     80-128 8 long LongCell.p10-p16
    136            (object boundary, size estimate)

psy.lob.saw.queues.spsc.fc.VolatileLongCell
 offset  size type description
      0    12      (assumed to be the object header + first field alignment)
     12     4      (alignment/padding gap)
     16-64  8 long VolatileLongCellP0.p0-p6
     72     8 long VolatileLongCellValue.value
     80-128 8 long VolatileLongCell.p10-p16
    136            (object boundary, size estimate)
If we cared more about memory consumption we could count the object header as padding and pad with integers to avoid the alignment gaps. I'm not that worried, so I won't. Note that the floating counters have to consume double the padding required for the flattened counters as they have no guarantees of their neighbours on either side. In the interest of comparing the impact of the data padding separately I also implemented a none data padding version.

Which one is more better?

While the charts produced previously are instructive and good at highlighting the variance, they make the post very bulky, so this time we'll try a table. The data with the charts is available here for those who prefer them. I've expanded the testing of JVM parameters a bit to cover the effect of the combinations of the 3 options used before, otherwise the method and setup are the same. The abbreviations stand for the following:
  • O1 - original lock-free SPSC queue with the original padding.
  • FC3 - Floating Counters, fully padded, data is not padded.
  • FC4 - Floating Counters, fully padded, data is padded.
  • I3 - Inlined Counters, fully padded, data is not padded.
  • I4 - Inlined Counters, fully padded, data is padded.
  • CCM - using the -XX:+UseConcCardMark flag
  • CT - using the -XX:CompileThreshold=100000 flag
  • NUMA - using the -XX:+UseNUMA flag
Same Core(each cell is min, mid, max, all numbers are in millions of ops/sec, bold is best result, red is best overall):
No OptsCCMCTNUMACCM+CTCCM+NUMACT+NUMACCM+CT+NUMA
O1107,108,11397,102,103111,112,11288,108,11397,103,103100,102,103111,112,112102,103,103
FC3105,108,113102,103,104111,112,113103,108,113102,103,10397,103,103111,112,113102,103,103
FC493, 96,10187, 89,9099,100,10182, 95,10089, 90,9086, 90,9081,101,10189, 90,90
I3103,123,13097, 98,100129,129,130122,129,130105,106,10797, 98,99128,129,130104,105,107
I4108,113,119103,105,106111,113,11399,118,120105,113,11498,104,114112,112,113105,114,114

Cross Core:
No OptsCCMCTNUMACCM+CTCCM+NUMACT+NUMACCM+CT+NUMA
O138, 90,13057, 84,13640, 94,10838, 59,11858, 98,11455,113,13039,53,10957,96,112
FC394,120,135109,141,15494,105,11798,115,124103,115,128116,129,14095,108,118102,120,127
FC4106,124,132118,137,152104,113,119107,119,130107,126,133114,132,150105,114,11999,123,131
I386,114,12288,113,12872, 96,11190,112,12386, 98,10885,117,12588,96,11190,99,108
I449,107,15678,133,17158,100,11248,126,155108,128,16488,143,17355,96,113104,115,164

I leave it to you to read meaning into the results, but my take aways are as follows:
  • Increasing the the CompileThreshold is not equally good for all code in all cases. In the data above it is not proving helpful of and by itself in the cross core case for any implementation. It does seem to help once CCM is thrown in as well.
  • Using ConCardMark makes a mighty difference. It hurts performance on the single core, but greatly improves the cross core case for all implementations. The difference made by CCM is covered by Dave Dice here and it goes a long way to explain the variance experienced in the inlined versions when running without it. 
  • NUMA makes little difference that I can see to the above cases. This is as expected since the code is being run on the same NUMA node throughout. Running across NUMA nodes we might see a difference.
  • As you can see there is still quite a bit of instability going on, though as an overall recommendation thus far I'd say I4 is the winner. FC4 is not that far behind when you consider the mid results to be the most representative. It also offers more stable overall results in terms of the variance.
  • 173M ops/sec! it's a high note worth musing over... But... didn't I promise you 250M? I did, you'll have to wait.
The above results also demonstrates that data inlining is a valid optimization with measurable benefits. I expect the results in more real-life scenarios to favor the inlined version even more as it offers better data locality and predictable access over the floating fields variants.
One potential advantage for the floating counters may be available should we be able to allocate the counters on their writer threads. I have not explored this option, but based on Dave Dice's observations I expect some improvement. This will make the queue quite awkward to set up, but worth a go.
There's at least one more post coming on this topic, considering the mechanics of the experiment and their implications. And after that? buggered if I know. But hang in there, it might become interesting again ;-)

UPDATE: thanks Chris Vest for pointing out I left out the link to the data, fixed now.


Monday, 15 July 2013

Single Producer Single Consumer Queue Revisited: An empiricist tale - part I


{This post is part of a long running series on lock free queues, checkout the full index to get more context here}
Applying lessons learnt about memory layout to prev. discussed SPSC (Single Producer Single Consumer) queue. Tackling and observing some manifestations of false sharing. Getting bitch slapped by reality.

In preparations to implement an MPMC (Many Producers Many Consumers) queue I went back to Martin Thompson's SPSC queue I dissected in detail in this blog post. I was going to use it as the basis for the new queue with a few changes and discuss the transition. In particular an opportunity offered in the implementation of said queue with the addition of the new getAndAdd intrinsic to JDK 8. I was going to... but then I thought, 'let me try a couple more things!' :-).

Where were we?

In case you can't be bothered to go back and read the whole thing again, here's a quick summary. Mr. Thompson open sourced a few samples he discusses in his presentation on lock-free algorithms, in particular a SPSC queue developed across a few stages. I broke down the stages further and benchmarked before and after to explore the effect of each optimisation as it is applied. I then ported the same queue into an off-heap implementation and used it to demonstrate a fast IPC mechanism capable of sending 135M messages per second between processes. The queue demonstrated the following techniques:
Snowman contemplating
evolution
  • lock free, single writer principle observed.
  • Set capacity to power of 2, use mask instead of modulo. 
  • Use lazySet instead of volatile write.
  • Minimize volatile reads by adding local cache fields.
  • Pad all the hot fields: head, tail, headCache,tailCache to avoid false sharing.
So... what's to improve on? There were a few niggles I had looking at this code again, some I've mentioned before. The last time I benchmarked the original queue implementation I noticed high run to run variance in the results. This was particularly prominent when running across 2 cores on the same socket or across sockets.
To expose the variance I modified the test to produce a summary line (each test runs 20 iterations, the summary is the average of the last 10 test iterations) and ran it 30 times. The results demonstrate the variance (results are sorted to highlight the range, X-axis is the run index, Y-axis is a summary of the run, SC means producer and consumer run on the same core, CC means they run across cores on the same socket):


Original queue performance
OUCH! We get half the performance 20% of the time. The results were very stable within a given run, leading me to believe there was a genuine issue at play.

So I thought, let's poke the i's and kick the t's, see if we can shake the variance out of the bugger.

Terms & Conditions

Benchmarks were carried out on a dual socket Xeon running CentOS 6 and Oracle JDK 1.7u17. Affinity was set using taskset, the scripts used are included with the code as well as the raw results and the LibreOffice spread sheets used for the graphs. Furry, fluffy animals were not harmed and people of different religions and races were treated with the outmost respect and afforded equal opportunity. I ran the cross socket tests, and the data is included, but I chose not to discuss them as no improvement was made on that front and they would make this already long post longer. 


Flatten me counters!

To start off, I was not thrilled with the way the counter padding was implemented, for 2 reasons:
  1. By using container classes for the counters we introduce indirection, we could optimise by inlining the data into the queue structure.
  2. The Padded* classes only pad to one side, we are counting on the instances to be laid out together because they are instantiated together. In the right environment I'm pretty sure this can go wrong. By go wrong I mean the instances might get allocated/placed next to data modified elsewhere leading to false sharing. By inlining the counters and forcing strict order we could kill 2 bird with one stone.
To inline the counters, and provide the padding required to provide false-sharing protection I used inheritance to force layout (as outlined previously here). I used Unsafe to get field offset and implement lazySet directly into the fields inlined in my class (this is replacing the original PaddedLong/PaddedAtomicLong, the same method is used in AtomicLong to implement lazySet) the code:

It ain't pretty, but it does the job. The layout can be verified using the excellent java-object-layout tool (I format the output for brevity):
psy.lob.saw.queues.spsc1.SPSCQueue1
 offset  size     type description
      0    12          (assumed to be the object header + first field alignment)
     12     4      int ColdFields.capacity
     16     4      int ColdFields.mask
     20     4 Object[] ColdFields.buffer
     24-72  8     long L1Pad.p10-16
     80     8     long TailField.tail
     88-136 8     long L2Pad.p20-p26
    144     8     long HeadCache.headCache
    152-200 8     long L3Pad.p30-36
    208     8     long HeadField.head
    216-264 8     long L4Pad.p40-46
    272     8     long TailCache.tailCache
    280-328 8     long L5Pad.p50-56
    336                (object boundary, size estimate)

Wicked! Run the same tests above to see what happened:
Original vs. Inlined counters(I1)

We get a small improvement when running on the same core (average 3% improvement), but the cross core behaviour is actually worse. Bummer, keep kicking. 

Padding the class fields

If we look at the above memory layout, we'll notice the fields capacity, mask and buffer are left flush against the object header. This means that they are open to false sharing with other objects/data allocated on the same cache line. We can add a further love handle on that big boy to cover that front:

Note that by happy coincidence we have already padded the tail side of the fields as part of our flattening exercise. So now the layout is:
psy.lob.saw.queues.spsc3.SPSCQueue3
 offset  size     type description
      0    12          (assumed to be the object header + first field alignment)
     12     4          (alignment/padding gap)
     16-72  8     long L0Pad.p00-07
     80     4      int ColdFields.capacity
     84     4      int ColdFields.mask
     88     4 Object[] ColdFields.buffer
     92     4          (alignment/padding gap)
     96-144 8     long L1Pad.p10-16
    152     8     long TailField.tail
    160-208 8     long L2Pad.p20-26
    216     8     long HeadCache.headCache
    224-272 8     long L3Pad.p30-36
    280     8     long HeadField.head
    288-336 8     long L4Pad.p40-46
    344     8     long TailCache.tailCache
    352-400 8     long L5Pad.p50-56
    408                (object boundary, size estimate)

Try again and we get:
Original vs Inlined counters and padded class(I3)


Same single core behaviour as above, but the cross core behaviour looks stable. Sadly the cross core results are worse than the original in many cases. Good thing there is one more trick up our sleeves.

Padding the data

So, this last step may seem a bit over the top, padding the sides of the buffer as well as spacing out all the bloody fields. Surely you must be joking? I padded the buffer by allocating an extra 32 slots to the array and skipping the first 16 on access. The object layout remains the same, you'll have to imagine the extra padding (code is here). But the results are:
Original vs Inlined counters, padded class and padded data(I4)


Run fat Q! Run! This is a nice kick in the single core category (10% increase) and in the cross core it is pretty flat indeed. So when the original behaves they are much the same, but the average result is a 10% improvement. Very little variance remains.

But it's UGLY!

Got me there, indeed it is. Why do we need to go this far to get rid of flaky behaviour? This is one of
Y do we care?
them times when having a direct line to memory management really helps, and Java has always been about you not having to worry about this sort of thing. There is help on the way in the form of the @Contended annotation which would render the above class much nicer, but even then you will need to pad the buffer by yourself. If you look at how the OffHeapQueue manages this issue, you'll see that less padding is required when you know the data alignment. Sadly there is no @Align(size=byte|short|int|long|cache|page) annotation coming anytime soon, and the @Contended annotation is not clear on how you could go about marking an instance rather than a class/field as contended.

Hang on, what if we do it the other way around?

For all you logical minded people out there who think: "we applied the changes together, but not separately. What if this is all about the data padding? we could fix the original without all this fuss...". I feel your pain obsessive brothers. So I went back and added 2 variants, one of a padded data original(referred to as O2 in the graphs) and another of the padded data and inlined fields without the class field padding. I was surprised by the results:

Same Core comparison of data padding impact


Padding the data, of and by itself made things worse for the original implementation and the inlined implementation when running on the same core. Padding the data sucks!
Cross Core comparison of data padding impact
When we look at the cross core results we can see some benefit from the data padding, suggesting it is part of the issue we are trying to solve, but not the whole story.
Padding the cold fields by itself also did little for the performance, as demonstrated above, but removed some of the variance. The 2 put together however gave us some extra performance, and killed the variance issue. Why? I don't know... But there you go, holistic effects of memory layout at work.

A happy ending?

Well... sort of. You see, all the above tests were run with the following JVM options:
-XX:+UseNUMA -XX:+UseCondCardMark -XX:CompileThreshold=100000
And thus the results present a certain truth, but maybe not all of the truth for everyone all of the time... I decided to waste some electricity and rerun some variations of the above options to see what happens. Running with no JVM options I got the following:
Cross core - no JVM opts
  • I4 which is the final inlined version is still quite stable, but it's performance lags behind the other implementations.
  • O1 which is the original implementation has less variance then before (could be luck, who knows) and has the best average result.

Same core - no JVM opts

  • This time I3 (inlined counters, padded class) is the clear winner.
  • I2 (inlined counters, padded data) is second, followed by I4 and I1.
  • When running on the same core, inlining the counters delivers a minor performance win.
Running with -XX:+UseCondCardMark:
ConcCardMark cross core
  • Using CondCardMark has reduced the range somewhat, but still a fair range for all.
  • I4 and I3 are stable, but the overall best average score goes to I1 (133M).
  • I4 is overall slightly better then O1 but worse then O2(original implementation with padded data)
ConcCardMark same core
  • I1 is the best by quite a bit, followed by I4.
Running with -XX:+UseCondCardMark -XX:CompileThreshold=100000:
-XX:+UseCondCardMark -XX:CompileThreshold=100000 - Cross Core
  • With the increased compile threshold O2 has pulled to the top followed by I4 and O1.
  • I4 is looking very much like O1
  • I1, which was the clear winner a second ago, is now rubbish.

-XX:+UseCondCardMark -XX:CompileThreshold=100000 - Same Core
  • On the same core we are seeing now the same behaviour we saw in the beginning.
  • I4 is the clear winner, I1 and I3 pushed down to second place etc.
  • This is odd, why would giving the JIT more data for compilation push the performance of I1 down?
And for comparison the results from -XX:+UseNUMA -XX:+UseCondCardMark -XX:CompileThreshold=100000 presented together:
All together now - Cross Core
  • I4 is the most stable, although O2 has the best overall average throughput.
  • Comparing with all the other combinations we seem to have degraded the performance of other options on our way to find the best option for I4 :(
All together now - Same Core

What does it all mean?

At this point I got quite frustrated. The above approach was producing improvements to the variance, and even an improvement to overall performance on occasion, but the effect was not as decisive and clear as I'd have liked. Some of the variation I just could not shake, even with the best result above I4 is still moving between 110M and 120M and has a spike on either side of this range.
These results are a fine demonstration of how time consuming and error prone the estimation of performance can be. To collect the above results I had to setup the same test to run for each implementation 30 times for each of the affinity options (same core/cross core/cross socket) and repeat
for 4 JVM options combinations (8 impls * 30 runs * 3 affinity setups * 4 JVM_OPTS + extra trial and error runs... = lots of time, quite a bit of data). This result is likely to be different on different hardware, it is likely to change with JDK8, other JVM options and so on. Even with all this effort of collecting data I am very far from having a complete answer. Is this data enough to produce meaningful results/insights at all?
To a certain extent there is evident progress here towards eliminating some of the sources of the run to run variation. Looking at the above results I feel justified in my interpretation of the object layout and the test results. In running the same code on other hardware I've observed good results for I4 and similar variation for the O1, so not all is lost. But this journey is, surprisingly enough, still not over...

More, more, more!

David Hume
If you found this riveting tale of minute implementation changes and their wacky effect on performance absorbing you will love the next chapter in which:
  • I explore cross socket performance and it's implications
  • We contemplate the ownership of memory and it's impact
  • The original implementation is evolved further
  • We hit a high note with 250M ops per second
This post is long enough as is :-)