Monday, 11 November 2013

SPSC IV - A look at BQueue

{This post is part of a long running series on lock free queues, checkout the full index to get more context here}
I thought I was done with SPSC queues, but it turns out they were not done with me...
A kind reader, Rajiv Kurian, referred me to this interesting paper on an alternative SPSC implementation called BQueue. The paper compares the BQueue to a naive Lamport queue, the FastFlow queue and the MCRingBuffer queue and claims great performance improvements both in synthetic benchmarks and when utilised in a more real world application. I had a read, ported to Java and compared with my growing collection, here are my notes for your shared joy and bewilderment.

Quick Summary of Paper Intro. Up To Implementation

I enjoyed reading the paper, it's not a hard read if you have the time. If not, here's my brief notes (but read the original, really):
  • Some chit chat goes into why cross core queues are important - agreed.
  • Paper claims many SPSC queues perform very differently in a test-bed vs real world, in particular as real world applications tend to introduce cache traffic beyond the trivial experienced in naive benchmarking - I agree with the sentiment, but I think the "Real World" is a challenging thing to bring into your lab in any case. I would argue that a larger set of synthetic experiments would serve us all better in reviewing queue performance. I also admit my benchmarking thus far has not been anywhere rich enough to cover all I want it to cover. The application presented by the authors is a single sample of the rich ocean of applications out there, who's to say they have found the one shoe which fits all? Having said that, it still strikes me as a good way to benchmark and a valid sample to add to the general "your mileage may vary, measure with your own application" rule.
  • Existing queue implementations require configuration or deadlock prevention mechanisms and are therefore harder to use in a real application -While this argument is partially true for the solutions discussed thus far on this blog, I fear for best results some tuning has to be done in any case. In particular the solution presented by the paper still requires some configuration.
  • Examines Lamport and points out cache line thrashing is caused by cross checking the head/tail variables -  Code for the Lamport variation can be found here.  The variant put forward by Martin Thompson and previously discussed here (with code here) solves this issue by employing producer/consumer local caches of these values. This enhancement and a more involved discussion of cache coherency traffic involved is further discussed here.
  • Examines FastForward queue, which is superior to Lamport but - "cache thrashing still occurs if two buffer slots indexed by head and tail are located in the same cache line". To avoid this issue FF employs Temporal Slipping which is another way of saying a sleep in the consumer if the head/tail are too close. This technique leads to cache thrashing again, and the definition of too close is the configuration mentioned and resented above. - Right, I was not aware of temporal slipping, but I love the term! Next time I'm late anywhere I'll be sure to claim a temporal slippage. More seriously: this strikes me as a streaming biased solution, intentionally introducing latency as the queue becomes near empty/full. From the way it is presented in the article it is also unclear when this method is to be used, as it is obviously not desirable to inflict it on every call.
  • Examine MCRingBuffer, which is a mix of 2 techniques: head/tail caching (like the one employed by Mr. T) and producer batching. The discussion focuses on the issues with producer batching (producer waits for a local buffer to fill before actually writing anything to the queue), in particular the risk of deadlock between 2 threads communicating via such queues - I would have liked the discussion to explore the 2 optimisations separately. The head/tail cache is a very valid optimisation, the producer batching is very problematic due to the deadlock issue described, but also as it introduces arbitrary latency into the pipeline. Some variations on the queue interface support batching by allowing the publisher to 'flush' their write to the queue, which is an interesting feature in this context.
  • Some discussion of deadlock prevention techniques follows with the conclusion that they don't really work.

Looking at the Implementation

So I've been playing with SPSC queues for a while and recently wrote a post covering both the FastFlow queue and the use of sparse data to eliminate the near empty thrashing issue described above. I was curious to see a new algorithm so ported the algorithm from the paper to Java. Note the scary Unsafe use is in order to introduce the required memory barriers (not NOOPs!). Here is what the new algo brings to the table when written on top of my already existing SPSC queues code (code here):

Changes I made to original (beyond porting to Java):
  • Renamed tail/head to be in line with my previous implementations.
  • Renamed the batch constants according to their use.
  • Left the modulo on capacity to the offset calculation and let the counters grow as per my previous implementations (helped me eliminate a bug in the original code).
In a way it's a mix of the FastFlow(thread local use of counters, null check the buffer to verify offer/poll availability) and the MC/Mr.T solutions(use a cached look ahead index value we know to be available a write/read up to that value with no further checks), which I like (yay cross pollination/mongrels... if you are into any variation on racial purity try having children with your cousins and let me know how it went). The big difference lies in the way near empty/full condition are handled. Here's a few points on the algorithm:
  • The cached batchHead/Tail are used to eliminate some of the offer/poll need to null compare we have in FFBuffer. Instead of reading the tail/head every time we probe ahead on the queue. This counts on the null/not-null regions of the queue being continuous:
    • For the producer, if the entry N steps ahead of TAIL (as long as N is less than capacity) is null we can assume all entries up to that entry are also null (lines 4-11). 
    • Similarly we probe ahead as we approach the near empty state, but here we are looking for a not null entry. Given that the not null region is continuous, we probe into the queue ahead of the HEAD, if the entry is null then we have overshot the TAIL. If it is not null we can safely read up to that point with no further check.
  • The BQueue offers us a variation on the above mentioned temporal slip that involves the consumer doing a binary search for a successful probe until it hits the next batch size or declares the queue empty (lines 40 - 49). This is triggered every time the consumer needs to re-calculate the batchHead value having exhausted the known available slots.
  • Every poll probe failure is followed by a spinning wait (line 55-59).
  • Using the buffer elements as the indicator of availability allows the BQueue to avoid reverting to the cache thrashing caused by comparing and sharing the head/tail counters. 
  • The slowdown induced by the algorithm and the spinning wait allows the producer to build up further slack in the queue.  
The temporal slip alternative is the main contribution celebrated in the paper, so it is worth comparing the code snippets offered for all variations.

A Word On Benchmarking

I ran the same benchmark I've been using all along to evaluate SPSC queues. It's synthetic and imperfect. The numbers you get in this benchmark are not the numbers you get in the real world. Your mileage is almost certain to vary. I've been getting some worried responses/twits/comments about this... so why do I use it? 
  • If you have been reading this series of posts you will see that the benchmark has been instrumental in identifying and measuring the differences between implementations, it's been good enough to provide evidence of progress or regression.
  • As a test harness it's been easy to use and examine via other tools. Printing out assembly, analysing hardware counter data, tweaking to a particular format: all easily done with a simple test harness. 
It's imperfect, but practical. I'm increasingly uncomfortable with it as a benchmark because I don't feel the harness scales well to multi-producer examination and I'm in the process of implementing the benchmarks using JMH. As that work is not complete I use what I have.
In the interest of completeness/open for review/honesty/general info, here is how I run benchmarks at the moment:
  1. I'm using my laptop, a Lenovo y510p. It's an i7-4700MQ.
  2. When running benchmarks I pin all running processes to core 0, then run my benchmarks on cores 1-7 (I avoid 1 if I can). It's not as good is isolcpus, but good enough for a quiet run IMHO.
  3. For this current batch of runs I also disabled the turbo-boost (set the frequency to 2.4GHz) to eliminate related variance. In the past I've left it on (careless, but it was not an issue at the time), summer is coming to South Africa and my machine overheats with it on.
  4. I'm running Ubuntu 13.10 64 bit, and using JDK7u45 also 64 bit.
  5. All the benchmarks were run with "-server -XX:+UseCondCardMark -XX:CompileThreshold=100000". I use these parameters for consistency with previous testing. In particular the UseCondCardMark is important in this context. See previous post for more in depth comparison of flags impact on performance.
  6. For this set of results I only examined the cross core behaviour, so the runs were pinned to core 3,7
  7. I do 30 runs of each benchmarks to get an idea of run to run variance.
I include the above as an open invitation for correction and to enable others to reproduce the results should they wish. If anyone has the time and inclination to run the same benchmarks on their own setup and wants to share the data I'd be very interested. If anyone has a suite of queue benchmarks they want to share, that would be great too.
As for the validity of the results as an indication of real world performance... the only indication of real world performance is performance in the real world. Having said that, some problems can be classified as performance bugs and I would argue that false-sharing, and bad choice of instructions falls under that category. All other things being equal I'd expect the same algorithm to perform better when implemented such that it's performance is optimal.

Taking BQueue for a Spin  

And how does it perform? It depends... on  the configuration(what? but they said?! what?). There are 3 parameters to tune in this algorithm:
  1. TICKS - how long to spin for when poll probing fails.
  2. POLL_MAX_BATCH_SIZE - the limit, and initial value for the poll probe.
  3. OFFER_BATCH_SIZE - how far to probe for offer, also note that OFFER_BATCH_SIZE elements will remain unused of the queue capacity (i.e the queue can only fit [capacity - OFFER_BATCH_SIZE] elements before offer fails).
I played around with the parameters to find a good spot, here's some variations (see the legend for parameters, X is run number, Y is ops/sec):
  1. There's no point in setting the batch sizes lower than 32 (that's 2 cache lines in compressed OOPS references) as we are trying to avoid contention. Also, it'll just end up being a confusing branch for the CPU to hit on and the whole point of batching is to get some amortized cost out of it. Even with batch sizes set as low as 32 for both the queue performs well (median is around 261M) but with significant variance.
  2. Upper left chart shows the results as the offer batch is extended (poll batch remains at 32). The larger offer batch offers an improvement. Note that extending the offer batch only gives opportunity for the producer to overtake the consumer as the consumer hits the poll probing logic every 32 steps. A large slack in the queue allows the best throughput (assuming consumer is mostly catching up). The variance also decreases as the offer batch is increased.
  3. Upper right chart shows the results for increasing the poll batch (offer batch remains at 32). As we can see this actually results in worse variance.
  4. Increasing both the offer and the batch size in step (lower left chart) ends up with better overall results, but still quite significant variance
  5. Keeping the offer/poll batch at 8k I varied the spin period which again results in a different profile, but no cure to variance.
For context here is the BQ result (I picked the relatively stable 80,32,8k run) compared with the FFBuffer port and my inlined counters variation on Thompson/Lamport with and without sparse data(Y8=inlined counters,the square brackets are parameters, for FF/Y8 it is the sparse shift so 2 means use every 4th reference):
[NOTE: previous benchmarks for same queues were run with turbo boost on, leading to better but less stable results, please keep in mind when considering previous posts]
As you can see the BQueue certainly kicks ass when compared to the non-sparse data variations, but is less impressive when sparse data is used. Note that BQueue manages to achieve this result with far less memory as it still packs the references densely (note that some memory still goes wasted as mentioned above, but not as much as in the sparse data variations).What I read into the above results:
  1. This algorithm tackles the nearly empty/full queue in an appealing manner. Probing the queue to discover availability is also a means of touching the queue ahead and bringing some required data into the cache.
  2. The main reason for the speed up is the slowing down of the consumer when approaching empty. This serves as a neat solution for a queue that is under constant pressure.
  3. The spinning wait between probes presents a potentially unacceptable behaviour. Consider for instance a consumer who is sampling this queue for data, but needs to get on with other stuff should it find it empty. Alternatively consider a low latency application with bursty traffic such that queues are nearly empty most of the time. 
  4. I'll be posting a further post on latency benchmarking the queues, but currently the results I see (across cores, implementing ping pong with in/out queue) suggest the FF queue offers the best latency(200ns RTT), followed by Y8(300ns) and the BQueue coming in last(750ns). I expect the results to be worst with bursty traffic preventing the batch history from correctly predicting a poll batch size.

Summary

This is an interesting queue/paper to me, importantly because it highlights 2 very valid issues:
  1. Near empty/full queue contention is a significant concern in the design of queues and solving it can bring large performance gains to throughput.
  2. Real application benefits may well differ from synthetic benchmark benefits. To support better decision making a wider variety of tests and contexts needs to be looked at.
I think the end solution is appropriate for applications which are willing to accept the latency penalty incurred by the consumer when hitting a nearly empty queue.  The near full queue guard implemented for this queue can benefit other queue implementations and has no downside that I can see beyond a moderate amount of wasted space. 
Thanks again to Rajiv Kurian for the pointer to this queue, and Norman M. for his help in reviewing this post.


Monday, 21 October 2013

A Lock Free Multi Producer Single Consumer Queue - Round 1

{This post is part of a long running series on lock free queues, checkout the full index to get more context here}
Writing a lock free MPSC queue based on the previous presented SPSC queues and exploring some of the bottlenecks inherent in the requirements and strategies to clearing them. 
2 or more...

Having just recovered from a long battle with the last of SPSC queue series posts I'm going to keep this short. This time we are looking at a slightly more common pattern, many producing threads put stuff on a queue which funnels into a single consumer thread. Maybe that queue is the only queue allowed to perform certain tasks (like accessing a Selector, or writing to a socket or a file). What could we possibly do for this use case?

Benchmark

We'll be comparing the performance of the different alternatives using this benchmark which basically does the following:
  1. Allocate a queue of the given size (always 32k in my tests) and type
  2. Start N producer threads:
    1. A producer thread offers 10M/N items (yield if offer fails)
    2. Start time before first item is enqueued
  3. In main thread consume [10M * N] items from queue, keep last item dequeued
  4. Stop timing: END
  5. Overall time is [END - minimum start from producers], print ops/sec and the last dequeued item
  6. Repeat steps 2 to 5, 14 times, keep ops/sec result in an array
  7. Print out summary line with average ops/sec for last 7 iterations
Very similar to previous benchmark for SPSC. The producers all wait for the consumer to give the go ahead, so contention is at it's worse (insert evil laughter, howling dogs). I ran the tests a fair few  times to expose run to run variance on a test machine (Ubuntu13.04/JDK7u40/i7-4700MQ) with 1 to 6 producer threads. To make the graphs a little easier to grok I took a representative run and for now will leave run to run variance to be discussed separately.


Baseline JDK Queues: ArrayBlockingQueue, ConcurrentLinkedQueue and LinkedTransferQueue

These are battle tested long standing favourites and actually support MPMC, so are understandably less specialized. ArrayBlockingQueue is also a blocking implementation, so we can expect it to experience some pain from that. Here's how they do:

We can see that CLQ/LTQ perform best when there's a single producer and quickly degrades to a stable baseline after a few producers join the party. The difference between 1 producer and many is the contention on offering items into the queue. Add to that the fact that the consumer is not suffering from the same amount of contention on it's side and we get a pile up of threads. ABQ gains initially from the addition of threads but then degrades back to initial performance. A full analysis of the behaviour is interesting, but I have no time for that at the moment. Let us compare them to something new instead.

From SPSC to MPSC

There's a few modifications required to make the SPSC implemented in previous posts into an MPSC. Significantly we need to control access to the tail such that publishers don't over write each others elements in the queue and are successful in incrementing the tail in a sequential manner. To do that we will:
  1. Have to replace the prev. lazy setting of the tail to it's new value (the privilege of single writers) with a CAS loop similar to the one employed in AtomicLong. 
  2. Once we successfully claimed our slot we will write to it. Note that this is changing the order of events to "claim then write" from "write then claim". 
  3. To ensure the orderly write of the element we will use a lazy set into the array
Here's the code:

I've dropped the use of a head cache, it's a pain to maintain across multiple threads. Lets start with this and consider reintroducing it later. In theory it should be a help as the queue is mostly empty.
Because of the above reversal of writes we now must contend in the consumer with the possibility of the tail index being visible before the element is:
  1. NOTE: This code does NOT implement Queue::poll according to the contract specified in the interface. In particular the method may return null when the queue is not empty, but the next element is not yet visible. This is expanded, explored and lamented in the following post: Poll me, maybe?. See the JCTools MpscArrayQueue implementation for Queue interface compliant code.
  2. Since the tail is no longer the definitive indicator of presence in the queue we can side step the issue by using the FastFlow algorithm for poll which simply tests the head element is not null without inspecting the tail counter. Note that the index is still the definitive indicator of queue emptiness: (tail != head).
  3. Since the producers are interested in the value of head we must orderly publish it by using lazy set otherwise it will be open to be assigned to a register...

The above code is worth working through and making sure you understand the reasoning behind every line (ask in the comments if it makes no sense). Hopefully I do too ;-). Was it worth it?

We get some improvement beyond CLQ (x2.5 with 1 producer, x1.7-1.3 as more producers are added), and that is maintained as threads are added, but we are basically stuck on the same issue CLQ is as the producers pile up, namely that we are spinning around the CAS. These queue basically scale like AtomicLong increments from multiple threads, this has been discuss previously here, benchmarking a counter is an included sample in JMH so I took the opportunity to checkout the latest and greatest in that awesome project and just tweaked it to my needs. Here is what AtomicLong scales like:
It's even worse than the queues at some point because the producer threads at least have other stuff to do apart from beating each other up. How can we contend with this issue?

A CAS spin backoff strategy

If you've used the Disruptor before you will find the idea familiar, instead of naively spinning we will allow some configuration of what to do when we are not getting our way, in the hope that time heals all things. I introduced the strategy in the form of an enum, but it's much of a muchness really:

And this is what the offer looks like with the CAS miss strategy in place:

There's a trade off here to be considered between a producers latency and the overall throughput of the system, I have not had time to experiment to that effect. Here's how the different back off strategies do:
As we can see the Park strategy offers the best throughput and seems to maintain it as the number of threads increase. The end result is a fair consistent 50M ops/sec throughput.

Notes and Reservations

I've not had time yet to explore this queue/problem as much as I would like and as such this post should be seen a rough first stab rather than an accomplished summary. In particular:
  1. I'm unhappy with the benchmark/test harness. The producer threads are bound to start and stop out of sync with each other which will lead to uneven levels of contention on the queue. A better way to measure the throughput would require taking multiple samples during a run and discarding the samples where not all producers are offering.
  2. Given time I would have liked to test on larger producer counts, at the very least expanding the graphs to 20 or so producers.
  3. While running the benchmarks I encountered some run to run variation. A larger data set of runs would have been the right way to go.
That said I think the result is interesting and I plan to explore further variations on this theme. In particular:
  1. An MPSC queue with looser FIFO requirements would allow much greater throughput. The challenges there are avoiding producer starvation and offering a degree of timeliness/fairness.
  2. In producing the MPSC queue I have taken another dive into the Disruptor code, a comparison between the Disruptor and the MPSC queue might prove interesting.
Finally, I was intending to port some of these rough experiments into an open source collection of queues for general use (some readers expressed interest). This will happen in the near future, time and space permitting.


Monday, 7 October 2013

SPSC revisited part III - FastFlow + Sparse Data


{This post is part of a long running series on lock free queues, checkout the full index to get more context here}
After I published the last post on this topic (if you want to catchup on the whole series see references below) I got an interesting comment from Pressenna Sockalingasamy who is busy porting the FastFlow library to Java. He shared his current implementation for porting the FastFlow SPSC queue (called FFBuffer) and pointed me at a great paper on it's implementation. The results Pressenna was quoting were very impressive, but when I had a close look at the code I found what I believed to be a concurrency issue, namely there were no memory barriers employed in the Java port. Our exchange is in the comments of the previous post. My thoughts on the significance of memory barriers, and why you can't just not put them in are recorded here.
Apart from omitting the memory barriers the FFBuffer offered two very interesting optimizations:
  1. Simplified offer/poll logic by using the data in the queue as an indicator. This removes the need for tracking the relative head/tail position and using those to detect full/empty conditions.
  2. Sparse use of the queue to reduce contention when the queue is near full or near empty (see musings below). This bloats the queue, but guarantees there are less elements per cache line (this one is an improvement put in by Pressenna himself and not part of the original)
So after getting off my "Memory Barriers are important" high horse, I stopped yapping and got to work seeing what I can squeeze from these new found toys.

FFBuffer - Simplified Logic

The simplified logic is really quite compelling. If you take the time to read the paper, it describes the queue with offer/poll loop I've been using until now as Lamport's circular buffer (the original paper by Lamport is here, not an easy read), full code is here, but the gist is:

I've been using a modified version which I got from a set of examples put forth by Martin Thompson as part of his lock free algos presentation and evolved further as previously discussed(padding is omitted for brevity):

With the FFBuffer variant Pressenna sent my way we no longer need to do all that accounting around the wrap point (padding is omitted for brevity):

The new logic is simpler, has less moving parts (no head/tail caching) and in theory looks like cache coherency traffic should be reduced by only bringing in the array elements which are required in any case.

The Near Empty/Full Queue Problem

At some point while testing the different queues I figured the test harness itself may be to blame for the run to run variance I was seeing. The fun and games I had are a story to be told some other time, but one of the thing that emerged from these variations on the test harness was the conclusion that testing a near empty queue produces very different results. By reversing the thread relationship (Main is producer, other thread is consumer, code here) in the test harness I could see great performance gains, the difference being that the producer was getting a head start in the race, creating more slack to work with. This was happening because the consumer and the producer are experiencing contention and false sharing when the queue has 1 to 16 elements in it. The fact that the consumer is reading a cache row that is being changed is bad enough, but it is also changing the same line by setting the old element to null. The nulling out of elements as they are read is required to avoid memory leaks. Also note that when the consumer/producer run out of space to read/write as indicated by their cached view of the tail/head they will most likely experience a read miss with the implications discussed previously here.
Several solutions present themselves:
  • Batch publication: This is a problem for latency sensitive applications and would require the introduction of some timely flush mechanism to the producer. This is not an issue for throughput focused applications. Implementing this solution will involve the introduction of some batch array on the producer side which is 'flushed' into the queue when full. If the batch array is longer than a cache line the sharing issue is resolved. An alternative solution is to maintain a constant distance between producer and consumer by changing the expectation on the consumer side to stop reading at a given distance.
  • Consumer batch nulling: Delay the nulling out of read elements, this would reduce the contention but could also result in a memory leak if some elements are never nulled out. This also means the near empty queue is still subject to a high level of coherency traffic as the line mutates under the feet of the reader.
  • Padding the used elements: We've taken this approach thus far to avoid contention around fields, we can apply the same within the data buffer itself. This will require us to use only one in N cells in the array. We will be trading space for contention, again. This is the approach taken above and it proves to work well.

Good fences make good neighbours

As mentioned earlier, the code above has no memory barriers, which made it very fast but also incorrect in a couple of rather important ways. Having no memory barriers in place means this queue can:
  • Publish half constructed objects, which is generally not what people expect from a queue. In a way it means that notionally stuff can appear on the other side of the queue before you sent it (because the code is free to be reordered by the compiler). 
  • The code can be reordered such that the consumer ends up in an infinite busy loop (the read value from the array can be hoisted out of the reading loop).
I introduced the memory barriers by making the array read volatile and the array write lazy. Note that in the C variation only a Write Memory Barrier is used, I have implemented variations to that effect but while testing those Pressenna informed me they hang when reading/writing in a busy loop instead of yielding (more on this later). Here's the final version (padding is omitted for brevity):

There are a few subtleties explored here:
  • I'm using Unsafe for array access, this is nothing new and is a cut and paste job from the AtomicReferenceArray JDK class. This means I've opted out of the array bound checks we get when we use arrays in Java, but in this case it's fine since the ring buffer wrapping logic already assures correctness there. This is necessary in order to gain access to getVolatile/putOrdered.
  • I switched Pressanas original field padding method with mine, mostly for consistency but also it's a more stable method of padding fields (read more on memory layout here).
  • I doubled the padding to protect against pre-fetch caused false sharing (padding is omitted above, but have a look at the code).
  • I replaced the POW final field with a constant (ELEMENT_SHIFT). This proved surprisingly significant in this case. Final fields are not optimized as aggressively as constants, partly due to the exploited backdoor in Java allowing the modification of final fields (here's Cliff Click's rant on the topic). ELEMENT_SHIFT is the shift for the sparse data and the shift for elements in the array (inferred from Unsafe.arrayIndexScale(Object[].class)) combined.
How well did this work? Here is a chart comparing it to the the latest queue implementation I had (Y5 with/Y4 without Unsafe array access), with sparse data shift set to 0 and 2 (benchmarked on Ubuntu13.04/JDK7u40/i7-4700MQ@2.40GHz using JVM params: -XX:+UseCondCardMark -XX:CompileThreshold=100000 and pinned to run across cores, results from 30 runs are sorted to make the the charts more readable):
Y=Ops per second, X=benchmark run
Shazzam! This is a damn fine improvement note that the algorithm switch is far less significant than the use of sparse data.
To further examine the source of the gain I benchmarked a variant with the element shift parametrized and a further variant with single padding (same machine and settings as above, sparse shift is 2 for all):
Y=Ops per second, X=benchmark run
Single padding seems to make little difference but parametrization is quite significant.

Applying lessons learnt

Along the way, as I was refining my understanding of the FFBuffer optimizations made above I applied the same to the original implementation I had. Here are the incremental steps:

  1. Y4 - Starting point shown above.
  2. Y5 - Use Unsafe to access array (regression).
  3. Y6 - Use sparse elements in the buffer.
  4. Y7 - Double pad the fields/class/array.
  5. Y8 - Put head/tailCache on same line, put tail/headCache on another line.
  6. Y81 - From Y8, Parametrize sparse shift instead of constant (regression).
  7. Y82 - From Y8, Revert to using array instead of Unsafe access (regression).
  8. Y83 - From Y8, Revert double padding of fields/class/array (regression).

Lets start with the journey from Y4 to Y8:
Y=Ops per second, X=benchmark run
Note the end result is slightly better than the FF one, though slightly less stable. Here is a comparison between Y8 and it's regressions Y81 to Y83:
Y=Ops per second, X=benchmark run
So... what does that tell us?

  • The initial switch to using Unsafe for array access was a regression as a first step (Y5), but proves a major boost in the final version. This is the Y82 line. The step change in its performance I think is down to the JIT compiler lucking out on array boundary check elimination, but I didn't check the assembly to verify.
  • Parametrizing is an issue here as well, more so than for the FFBuffer implementation for some reason.
  • I expected Y83 (single padding) to be the same or worse than Y6. The shape is similar but it is in fact much better. I'm not sure why...
  • There was a significant hiccup in the field layout of Y4/5/6 resulting in the bump we see in going from Y6 to Y7 and the difference between Y83 and Y6. As of now I'm not entirely certain what is in play here. It's clear that pre-fetch is part of it, but I still feel I'm missing something.
So certainly not all is clear in this race to the top but the end result is a shiny one, let's take a closer look at the differences between Y8 and FFO3. Here's a comparison of these 2 with sparse data set to 0,1,2,3,4 running cross cores:
From these results it seems that apart from peaking for the s=2 value, Y8 is generally slower than FFO3. FFO3 seems to improve up to s=3, then drop again for s=4. To me this suggests FFO3 is less sensitive to the effect of the near empty queue as an algorithm.
Next I compared the relative performance of the 2 queue when running on the same core, this time only s=0, 2 where considered:
This demonstrates that FFO3 is superior when threads are running on the same core and still benefits from sparse data when running in that mode. Y8 is less successful and seem to actually degrade in this scenario when sparse data is used. Y8 offers a further optimization direction I have yet to fully explore in the form of batching consumer reads, I will get back to it in a further post.

On Testing And A Word Of Warning

I've been toying around with several test harnesses which are all on GitHub for you to enjoy. The scripts folder also allows running the tests in different modes (you may want to adjust the taskset values to match your architecture). Please have a play. Mostly the harnesses differ in the way they measure the scope of execution and which thread (producer/consumer) acts as the trigger for starting the test and so on. Importantly you will find there is the BusyQueuePerfTest which removes the Thread.yield() call when an unsuccessful offer/poll happens.
During the long period in which this post has been in the making (I was busy, wrote other posts... I have a day job... it took forever) Pressana has not been idle and got back to me with news that all the implementations which utilize Unsafe to access the array (Y5/SPSCQueue5 and later,  most of the FFBuffer implementations) were in fact broken when running the busy spin test and would regularly hang indefinitely. I tested locally and found I could not reproduce the issue at all for the SPSCQueue variations and could only reproduce it for the FFBuffer implementations which used no fences (the original) or only the STORE/STORE barrier (FFO1/2). Between us we have managed to verify that this is not an issue for JDK7u40 which had a great number of concurrency related bug fixes in it, but is an issue for previous versions! I strongly suggest you keep this in mind and test thoroughly if you intend to use this code in production.


Summary

This post has been written over a long period, please forgive any inconsistencies in style. It covers a long period of experimentation and is perhaps not detailed enough... please ask for clarifications in comments and I will do my best to  answer. Ultimately, the source is there for you to examine and play with and has the steps broken down such that a diff between step should be helpful.
This is also now part 5 in a series of long running posts, so if you missed any or forgotten it all by now here they are:
  1. Single Producer/Consumer lock free Queue step by step: This is covering the initial move from tradition JDK queues to the lock free variation used as a basis for most of the other posts
  2. 135 Million messages a second between processes in pure Java: Taking the queue presented in the first post and taking it offheap and demonstrating its use as an IPC transport via a memory mapped file
  3. Single Producer Single Consumer Queue Revisited: An empiricist tale - part I: Looking at run to run variation in performance in the original implementation and trying to cure it by inlining the counter fields into the queue class
  4. SPSC Revisited - part II: Floating vs Inlined Counters: Here I tried to access to impact of inlining beyond fixing up the initial implementations exposure to false sharing on one side.
And here we are :-), mostly done I think.
I would like to thank Pressana for his feedback, contribution and helpful discussion. He has a website with some of his stuff on, he is awesome! As mentioned above the idea for using sparse data is his own (quoting from an e-mail):
"All I tried was to cache align access to the elements in the array as it is done in plenty of c/c++ implementations. I myself use arrays of structs to ensure cache alignment in C. The same principle is applied here in Java where we don't have structs but only an array of pointer. "
Finally, the end result (FFO3/Y8) is incredibly sensitive to code changes as the difference between using a constant and field demonstrates, but also performs very consistently between runs. As such I feel there is little scope for improvement left there... so maybe now I can get on to some other topics ;-).

Sunday, 15 September 2013

Diving Deeper into Cache Coherency

I recently gave a talk about Mechnical Sympathy at Facebook, which was mostly a look at the topic through the SPSC queue optimization series of posts. During the talk I presented the optimisation step (taken in Martin's original series of queue implementations) of adding a cache field for the head and tail. Moving from this:

To this:


This change yields a great improvement in throughput which I explained to be down to the reduction in coherency traffic between the cores. This is:
  1. Not what I stated previously here.
  2. A very brief and unsatisfying explanation.
I shall try and remedy that in this post.


Penance

In my original step by step post I explained the benefit of the above optimization is the replacement of a volatile read with a plain read. Martin was kind enough to gently correct me in the comments:
"The "volatile read" is not so much the issue. The real issues come from the read of the head or tail from the opposite end will pretty much always result in a cache miss. This is because the other side is constantly changing it."
and I argued back, stating the JIT compiler can hoist the field into a register and wistfully wishing I could come up with an experiment to prove one way or the other.  I was mostly wrong and Martin was totally right. 
I say mostly and not entirely because eliminating volatile reads is not a bad optimization and is responsible for part of the perf improvement. But it is not the lion share. To prove this point I have hacked the original version to introduce volatile reads (but still plain writes) from the headCache/tailCache fields. I won't bore you with the code, it's using the field offset and Unsafe.getLongVolatile to do it.
I ran the test cross core for 30 times and averaged the summary results. Running on new hardware (so no reference point to prev. quoted results) i7-4700MQ/Ubuntu 13.04/JDK7u25. Here are the results, comparing Original21 (head/tail padded, no cache fields), Original3 (head/tail padded, head/tailCache padded) and VolatileRead (same as Original3, but with volatile read of cache fields):

Original21:     65M ops/sec
Original3:     215M ops/sec
VolatileRead:  198M ops/sec

As we can see, there is no massive difference between Original3 and VolatileRead (especially when considering the difference from Original21), leading me to accept I need to buy Martin a beer, and apologize to any reader of this blog who got the wrong idea reading my post.
Exercise to the reader: I was going to run the above with perf to quantify the impact on cache-misses, but as perf doesn't support this functionality on Haswell I had to let it go. If someone cares to go through the exercise and post a comment it would be most welcome.


What mean cache coherency?

Moving right along, now that we accept the volatile read reduction is not the significant optimization here, let us dig deeper into this cache coherency traffic business. I'll avoid repeating what is well covered elsewhere (like cache-coherence, or MESIF on wikipedia, or this paper, some excellent examples here, and an animation for windows users only here) and summarize:
MESI State Diagram
  • Modern CPUs employ a set of caches to improve memory access latency.
  • To present us with a consistent view of the world when concurrent access to memory happens the caches must communicate to give us a coherent state.
  • There are variations on the protocol used. MESI is the basic one. Recent intels use MESIF. In the examples below I use MESI as the added state in MESIF adds nothing to the use case.
  • The guarantee they go for is basic:
    • One change at a time (to a cache line): A line is never in M state in more than one place. 
    • Let me know if I need a new copy: If I have a copy and someone else changed it I need to get me a new copy. (My copy will move from Shared to Invalid)
All of this happens under the hood of your CPU without you needing to lose any sleep, but if we somehow cause massive amounts of cache coherency traffic then our performance will suffer. One note about the state diagram. The observant reader (thanks Darach) will notice the I to E transition for Processor Write(PW) is in red. This is not my diagram, but I think the reason behind it is that the transition is very far from trivial (or a right pain in the arse really) as demonstrated below.


False Sharing (once more)

False sharing is a manifestation of this issue where 2 threads are competing to write to the same cache line which is constantly Invalid in their own cache.

Here's a blow by blow account of false sharing in terms of cache coherency traffic:
  1. Thread1 and Thread2 both have the false Shared cache line in their cache
  2. Thread1 modifies HEAD (state goes from S to E), Thread2's copy is now Invalid
  3. Thread2 wants to modify TAIL but his cache line is now in state I, so experiences a write miss:
    1. Issue a Read With Intent To Modify (RWITM)
    2. RWITM intercepted by Thread1
    3. Thread1 Invalidates own copy
    4. Thread1 writes line to memory
    5. Thread2 re-issues RWITM which results in read from memory (or next layer cache)
  4. Thread1 wants to write to HEAD :( same song and dance again, the above gets in it's way etc.

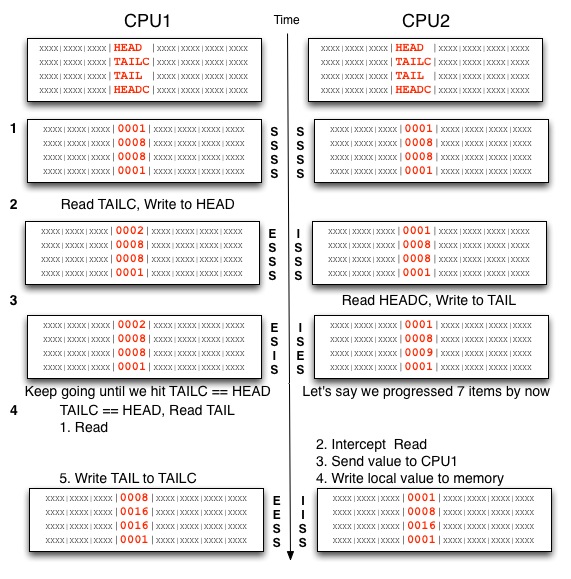
The diagram to the right is mine, note the numbers on the left track the explanation and the idea was to show the cache lines as they mutate on a timeline. Hope it helps :-).


Reducing Read Misses

So False Sharing is really bad, but this is not about False Sharing (for a change). The principal is similar though. With False Sharing we get Write/Read misses, the above manoeuvre is about eliminating Read misses. This is what happens without the HEADC/TAILC fields (C for cache):
  1. Thread1 and Thread2 both have the HEAD/TAIL  cache lines in Shared state in their cache
  2. Thread1 modifies HEAD (state goes from S to E), Thread2's copy is now Invalid
  3. Thread2 wants to read HEAD to check if the queue wrapped, experiences a Read Miss:
    1. Thread2 issues a request for the HEAD cache line
    2. Read is picked up by Thread1
    3. Thread1 delivers the HEAD cache line to Thread2, the request to memory is dropped
    4. The cache line is written out to main memory and now Thread1/2 have the line in Shared state
This is not as bad as before, but is still far from ideal. The thing is we don't need the latest value of HEAD/TAIL to make progress, it's enough to know that the next increment to our counter is available to be used. So in this use case, caching the head/tail gives us a great win by avoiding all of these Read Misses, we only hit the Read Miss when we run out of progress to be made against our cached values. This looks very different:
  1. Thread1 and Thread2 both have the HEAD/TAIL/HEADC/TAILC  cache lines in Shared state in their cache (the TAILC is only in Thread1, HEADC is only in Thread2, but for symmetry they are included).
  2. Thread1 reads TAILC and modifies HEAD (state goes from S to E), Thread2's copy is now Invalid.
  3. Thread2 reads from HEADC which is not changed. If TAIL is less than HEADC we can make progress (offer elements) with no further delay. This continues until TAIL is equal to HEADC. As long as this is the case HEAD is not read, leaving it in state M in Thread1's cache. Similarly TAIL is kept in state M and Thread2 can make progress. This is when we get the great performance boost as the threads stay out of each others way.
  4. Thread1 now needs to read TAIL to check if the queue wrapped, experiences a Read Miss:
    1. Thread1 issues a request for the TAIL cache line
    2. Request is picked up by Thread2
    3. Thread2 delivers the TAIL cache line to Thread1, the request to memory is dropped
    4. The cache line is written out to main memory and now Thread1/2 have the line in Shared state
    5. TAIL is written to TAILC (TAILC line is now E)
The important thing is that we spend most of our time not needing the latest HEAD value which means Thread2 is not experiencing as many Read Misses, with the added benefit of the threads not having to go back and forth from Shared to Exclusive/Modified state on writes. Once I have a line in the M state I can just keep modifying with no need for any coherence traffic. Also note we never experience a Write Miss.


Summary

In an ideal application (from a cache coherency performance POV) threads never/rarely hit a read or write miss. This translates to having single writers to any piece of data, and minimizing reads to any external data which may be rapidly changing. When we are able to achieve this state we are truly bound by our CPU (rather than memory access).
The takeaway here is: Fast moving data should be in M state as much as possible. A read/write miss by any other thread competing for that line will lead to reverting to S/I which can have significant performance implications. The above example demonstrates how this can achieved by caching stale but usable copies locally to another thread.

Tuesday, 6 August 2013

JMM Cookbook Footnote: NOOP Memory Barriers on x86 are NOT FREE

In Doug Lea's excellent JMM Cookbook the following observation is made about memory barriers on different architectures:
Processor LoadStore LoadLoad StoreStore StoreLoad Data
dependency
orders loads?
Atomic
Conditional
Other
Atomics
Atomics
provide
barrier?
sparc-TSO no-op no-op no-op membar (StoreLoad) yes CAS: casa swap,ldstub full
x86 no-op no-op no-op mfence or
cpuid or
locked insn
yes CAS:
cmpxchg
xchg,
locked insn
full
ia64 combine
with

st.rel or
ld.acq
ld.acq st.rel mf yes CAS:
cmpxchg
xchg,
fetchadd
target +
acq/rel
arm dmb
(see below)
dmb
(see below)
dmb-st dmb indirection
only
LL/SC:
ldrex/strex

target
only
This leads quite a few people to conclude that there is no performance cost to the memory barriers that are marked no-op, and on occasion leads people to believe they can just not put them in at all. After all, what is the point in a no-op? surely a program with the no-ops removed is the same program, right? Wrong...
After having this debate again recently I thought I'd document it here to avoid repetition, and to get some second opinions I got some help from the good people on the concurrency-interest mailing list.

What's a Memory Barrier?

This is Noop
From the Cookbook:
"Compilers and processors must both obey reordering rules. No particular effort is required to ensure that uniprocessors maintain proper ordering, since they all guarantee "as-if-sequential" consistency. But on multiprocessors, guaranteeing conformance often requires emitting barrier instructions...
...Memory barrier instructions directly control only the interaction of a CPU with its cache, with its write-buffer that holds stores waiting to be flushed to memory, and/or its buffer of waiting loads or speculatively executed instructions."
We need memory barriers to help the compiler and CPU make sense of our intentions in terms of concurrency. We need to hold them back from optimizing away code that can be eliminated or re-ordered if optimal single threaded execution is the only consideration. The last bit suggests that barriers are really about memory ordering.

Why isn't it free?

Volatile reads (LoadLoad) and lazySet/putOrdered (StoreStore) are both "No-op"s on x86. Mike Barker (LMAX dude, maintainer and contributor to the Disruptor, here's his blog) replied to my request for clarification:
"The place to look (as definitive as it gets for the hardware) is section 8.2.2, volume 3A of the Intel programmer manual.  It lists the rules that are applied regarding the reordering of instructions under the X86 memory model.  I've summarised the relevant ones here:
- Reads are not reordered with other reads.
- Writes are not reordered with older reads.
- Writes to memory are not reordered with other writes.
- Reads may be reordered with older writes to different locations but not with older writes to the same location.
The only reordering that will occur with x86 is allowing reads to be executed before writes (to other locations), hence the need for a LOCKed instruction to enforce the store/load barrier.  As you can see with the above rules, store are not reordered with older stores and loads are not reordered with older loads so a series of MOV instructions is sufficient for a store/store or a load/load barrier."
So since a volatile read and a lazySet both boil down to a MOV from/to memory, no further special instruction is required (hence no-op) as the underlying architecture memory model obeys the rules required by the JMM (Note: lazySet is not in the JMM, but is as good as in it, I go into the origins of lazySet here). But while that does mean these barriers are cheap it doesn't make them free. The above rules Mike is quoting are for the generated assembly, but the barriers impact the compiler as well. Memory barriers are there to stop your code being interpreted a particular way by both the compiler and the CPU. The JMM guarantees that memory barriers are respected by BOTH. This is important because the JMM Cookbook is talking about CPU no-ops, not compiler no-ops. Vitaly Davidovich from concurrency interest replied:
"Yes, volatile loads and lazySet do not cause any cpu fence/barrier instructions to be generated - in that sense, they're noop at the hardware level.  However, they are also compiler barriers, which is where the "cheap but ain't free" phrase may apply. The compiler cannot reorder these instructions in ways that violate their documented/spec'd memory ordering effects. So for example, a plain store followed by lazySet cannot actually be moved after the lazySet; whereas if you have two plain stores, the compiler can technically reorder them as it sees fit (if we look at just them two and disregard other surrounding code). So, it may happen that compiler cannot do certain code motion/optimizations due to these compiler fences and therefore you have some penalty vs using plain load and stores.  For volatile loads, compiler cannot enregister the value like it would with plain load, but even this may not have noticeable perf diff if the data is in L1 dcache, for example."
The difference in performance between using a plain write and a lazySet has been demonstrated in this post if you look at the difference between the putOrdered and plain writes versions. I expect this difference is far more pronounced in a benchmark than in a full blown system, but the point is it's a demonstrable difference. Similarly here Mr. Brooker demonstrates there is a difference between normal reads and volatile reads. There's a flaw in the experiment in that the volatile writes are making the volatile reads slower, but his point is valid as a demonstration of inhibited optimization (loop is not unrolled, value is not enregistered) and the uncontended read tells that story well.

So... I can't just drop it out of my program?

The TSO model for x86 dictates how your code will behave, if you were writing assembly. If you are writing Java, you are at the mercy of the JIT compiler first, and only then the CPU. If you fail to inform the compiler about your intentions, your instructions may never hit the CPU, or may get there out of order. Your contract is with the JMM first.
It's like punctuation: "helping your uncle Jack off a horse" != "helping your uncle jack off a horse" => punctuation is not a no-op ;-)

Monday, 29 July 2013

Atomicity of Unaligned Memory Access in Java

This is an attempt to clarify and improve on previous statements I've made here (and before that here) on unaligned memory access and it's implications. Let's start from the top:
  1. Unaligned access is reading/writing a short/int/long from/to an address that is not divisible by it's size.
  2. Unaligned access to data on the heap is not possible without using sun.misc.Unsafe.
  3. Unaligned access to data off the heap is possible via direct ByteBuffer.
  4. Unaligned access to data is very possible using unsafe both on/off heap.
  5. Unaligned access is therefore bad news even for good boys and girls using direct ByteBuffer, as the result on unaligned access are architecture/OS specific. You may find that your code crashes inexplicably on some processes when running some OSs.
  6. Unaligned access atomicity pure and simple is not a JVM issue. You can only "legally" do it by using direct ByteBuffer, and that is explicitly not a thread safe object so you are in no position to expect atomicity (As an aside, in heap ByteBuffers all writes are not atomic)
  7. What happens on unaligned access stays on unaligned access ;-)
So unaligned access is a problem for the few, and concurrent unaligned access is a problem for naughty, tricksy hobbitses who want to play with matches. Such devils may want to write an IPC, or use off heap memory to store structs, and are hoping to get coherent results. Here's my results thus far for x86 processors. Skip to the summary at the end if you don't care for the journey.

Unaligned access within the cache line

Unaligned access within the cache line is not atomic on older Intel processors, but is atomic on later models (from the intel developer manual under 8.1.1 Guaranteed Atomic Operations): 
"The P6 family processors (and newer processors since) guarantee that the following additional memory operation will always be carried out atomically: 
  • Unaligned 16-, 32-, and 64-bit accesses to cached memory that fit within a cache line"
To demonstrate this time around I'll use a simpler means than JCStress and just roll my own, the same tests are available on my fork of JCStress here. The same test will be used for the cross line test, and it covers all 3 flavours of visible writes (ordered/volatile,CAS):
We expect the test to run forever (or as long as we need to feel comfortable) if the writes are atomic. If they are not we expect the test to write "WTF" and exit early. Running the test for all write variations with an offset of 12 leads to no breakage of atomicity when run on a Core2Duo and Xeon, this test should break (i.e exit early, WTF) on older processors and this result has been confirmed to indeed happen.
So far so good, unaligned access is confirmed atomic on recent Intel processors and the evidence supports the documentation.


Unaligned access across the cache line

Crossing the cache line falls outside the scope of the prev. statement quoted so is not atomic unless we use the LOCK instruction (see under 8.1.2.2 Software Controlled Bus Locking):
"The integrity of a bus lock is not affected by the alignment of the memory field. The LOCK semantics are followed for as many bus cycles as necessary to update the entire operand. However, it is recommend that locked accesses be aligned on their natural boundaries for better system performance... Locked operations are atomic with respect to all other memory operations and all externally visible events."
Cool, so... which one is locked? One way to find out is run the test, so I did.... and... it looks like none...
So nothing is locked? that seemed wrong.
Certainly CAS is locked. CAS translates directly into LOCK CMPXCHG, so definitely locked, and yet the experiment definitely fails. This is as far as I got with JCStress, and this result raised some eyebrows. Re-reading through the code I wrote for JCStress didn't raise any suspicion, so I wrote a variation of the above test and still it looked like the CAS values are broken.
I have to admit I was happy to leave it at that, and in some ways it is not a wrong conclusion, but I met with some insistent doubt from Mr. Gil Tene of Azul. With both Gil and the Intel manual insisting this is not right I had a final go at cracking this contradiction and read through the assembly. The CAS writes are indeed as expected LOCK CMPXCHG, but the volatile read is:
  0x0000000106b5d60c: movabs r10,0x7f92a38248fc
  0x0000000106b5d616: mov    r10,QWORD PTR [r10]  ;*invokevirtual getLongVolatile
A MOV with no lock! So it is perhaps not the CAS that is broken, it is the volatile read. To prove the point I change the test for broken values to be:

And indeed, with this version CAS is proved to never deliver broken values, CAS is atomic across the cache line. But... as far as Java is concerned, this is only of use if you want to use CAS to test for the written values, which is not that useful. This highlights the fact that while CAS is implemented using LOCK CMPXCHG, it does not have the same interface. CMPXCHG returns the current value even on failure. That would have been exactly what we'd want to replace the volatile read in this particular and admittedly perverse case.
Now with the new atomic observation we can re-examine the atomicity of the ordered and volatile writers. And find, to our shared joy/sorrow that they are just as broken as before. The ordered write should come as no surprise as it is a plain MOV, but the volatile write is a bit surprising (to me if not to others. Gil for instance wasn't surprised, the clever bastard). It's a close call thing, you could implement a volatile write using a single locked instruction (LOCK XCHG), but the actual implementation is via a MOV followed by a LOCK ADD (see end of Martin's post and comments for discussion on that implementation choice). As things currently stand, cache line crossing volatile writes are not atomic.

Summary & Credits

Rules of unalignment thus far are:
  1. If you can at all help it, read and write aligned data.
  2. Unaligned writes and reads within the cache line are atomic on recent Intel processors, but not atomic on older models.
  3. Unaligned writes and reads across the cache line are not atomic unless they are locked.
  4. Of the available options, only CAS is locked. There is no locked way to read an arbitrary value.
  5. Volatile/Ordered writes are not atomic, volatile read is also not atomic.
The above is true for Intel x86, but I would not expect other processors to behave the same.
This post is really a summary of the combined efforts and ideas by Gil, Martin (thanks guys) and myself. Any errors are in all probability mine, please let me know if you find any. The test code is here, you can run with any offset, write type or read type by playing with the system properties, have a play and let me know your results. I'm particularly curious to hear from anyone running on non-intel processors who can share their results.

Wednesday, 24 July 2013

Java Concurrency Torture Update: Don't Stress

A piece of late news: the concurrency suite is back. And so is my little test on top of it.
A few months ago I posted on yet another piece of joyful brilliance crafted by Master Shipilev, the java-concurrency-suite. I used the same framework to demonstrate some valid concerns regarding unaligned access to memory, remember children:
  • Unaligned access is not atomic
  • Unaligned access is potentially slow, in particular:
    • On older processors
    • If you cross the cache line
  • Unaligned access can lead to SEG_FAULT on non-intel architectures, and the result of that might be severe performance hit or your process crashing...
It was so much fun that someone had to put a stop to it, and indeed they did.
The java-concurrency-suite had to be removed from github, and the Master Inquisitor asked me to stop fucking around and remove my fork too, if it's not too much trouble... so I did.
Time flew by and at some point the powers that be decided the tool can return, but torture was too much of a strong word for those corporate types and so it has been rebranded JCStress. JC is nothing to do with the Jewish Community, as some might assume, it is the same Java Concurrency but now it's not torture (it's sanctioned after all), it's stress. Aleksey is simply stressing your JVM, he is not being excessively and creatively sadistic, that would be too much!
Following the article I had a short discussion with Mr T and Gil T with regards to unaligned access in the comments to Martin's blog post on off-heap tuple like storage. The full conversation is long, so I won't bore you, but the questions asked were:
  1. Is unaligned access a performance only, or also a correctness issue?
  2. Are 'volatile' write/reads safer than normal writes/reads?
The answers to the best of my understanding are:
  1. Unaligned access is not atomic[Correction 23/09/2013: On later Intel processor unaligned access within the cache line is atomic, but access across the line is not. See update below and related later post], and therefore can lead to the sort of trouble you will not usually experience in your programs (i.e half written long/int/short values). This is a problem even if you use memory barriers correctly. It adds a 'happened-badly' eventuality to the usual happens before/after reasoning and special care must be taken to not get slapped in the face with a telephone pole.
  2. Volatile read/writes are NOT special. In particular doing a CAS[Correction 23/09/2013: CAS is atomic, all others are not. See update below and related later post]/putOrdered/putVolatile write to an unaligned location such that the value is written across the cache line is NOT ATOMIC.
This came up in a discussion recently, which prompted me to go and fork JCStress on to bitbucket and rerun the experiments on both a Core2Duo and a Xeon processor and re-confirmed the result. This is a problem for folks considering the Atomics for ByteBuffer suggestion discussed on the concurrency-interest mailing list. There is nothing in the ByteBuffer interface to stop you from doing unaligned access...

UPDATE (1/08/2013): Shipilev's slides from JVMLS lightning talk.

UPDATE (23/09/2013): I've discussed the issue further with Gil and Martin, which led to the following post. Some corrections to the above observations have been made which I now inlined above.