Monday, 28 January 2013

Experimentation Notes: Java Print Assembly

Summary: How to print out Java compiled assembly instructions on Linux/MacOS. Not hard to do, just a reminder how.
This is with the Oracle JDK 7, on Ubuntu 12.10, but should work similarly elsewhere.
To get the assembly code print out of your java process add the following options to your Java command line:
java -XX:+UnlockDiagnosticVMOptions -XX:+PrintAssembly ...
Which doesn't work :( :
Java HotSpot(TM) 64-Bit Server VM warning: PrintAssembly is enabled; turning on DebugNonSafepoints to gain additional output
Could not load hsdis-amd64.so; library not loadable; PrintAssembly is disabled
So where do you get hsdis-amd64.so? and where should you put it?
  • Project Kenai got different versions for download, pick the one that matches your OS.
  • Rename it to hsdis-amd64.so and put it under /usr/lib/jvm/java-7-oracle/jre/lib/amd64/ the actual path on your machine may differ if you installed your JDK in another method/put it elsewhere etc.
Sorted! Enjoy a fountain of assembly code spouting from your code.
You may only be interested in the assembly generated for a particular method though. To only get output for particular methods you can use the -XX:CompileCommand=print,*.Foo.bar option. Be aware that the output may not reflect the running code if the method gets further inlined to a particular callsite. You can verify by looking at the -XX:+PrintInlining output to see if the method gets inlined.

Update 18/04/2013: For MacOS you'll need to get the version here and similarly copy it to your JAVA_HOME/jre/lib:
sudo mv ~/Downloads/hsdis-amd64.dylib /Library/Java/JavaVirtualMachines/jdk1.7.0_17.jdk/Contents/Home/jre/lib/hsdis-amd64.dylib
Update 19/04/2013: To get intel syntax over AT&T, use -XX:PrintAssemblyOptions=intel (learnt this today after having a read of  blog, he covered this topic a few months before I did and his instructions cover Windows as well, great blog)

Update 10/02/2014: Also notable on this topic is JITWatch, a dissassembly log analysis UI to correlate the print assembly output with your code (and more)

Update 12/02/2015: A further observation sent my way by Jason Nordwick:
"If you are on 64-bit OpenJDK, hsdis from Kenai will crash. You need to download and build a working copy yourself. Here is the questions I posed (and answered myself a little later) on AskUbuntu SO:

http://askubuntu.com/questions/581025/recent-java-8-update-and-now-printassembly-crashes-on-14-10"
Thanks Jason!

Update 09/01/2017: Turns out there's a very detailed answer on SO these days, in particular on how to build hsdis and the Windows variant usage:
http://stackoverflow.com/questions/1503479/how-to-see-jit-compiled-code-in-jvm?rq=1

Monday, 21 January 2013

Using Caliper for writing Micro Benchmarks

Summary: Caliper is a micro benchmarking framework, here's how to get going with it using Ant + Ivy. Showing a before/after of an existing benchmark and working around the broken dependency/option for measuring memory allocation.
Writing Micro-Benchmarks in Java is famously hard/tricky/complicated. If you don't think so read these articles:
Caliper is an open source project which aims to simplify the issue by... giving you a framework for writing benchmarks! It's still a bit rough around the edges, but already very useful.


Get started

I'll assume you got Ant sorted and nothing more, you'll need to add Ivy support to your build. You can use the following which I cannibalised from the Ivy sample:
And you will need an ivy.xml file to bring in Caliper:
You'll notice the allocation dependency is excluded and that the build has a task in it to download the jar directly from the website... there's good reason for that. Ivy uses maven repositories to get it's dependencies and the java-allocation-instrumenter maven produced jar is sadly broken. You can fix it by downloading it manually from here. There is probably a cleaner way to handle this with Ivy using resolvers and so on, but this is not a post about Ivy, so I won't bother.
You can use an Eclipse plugin to support Ivy integration and bring the jars into your project. You'll still need to get the allocation.jar and sort it out as described below.
Now that we got through the boring bits, let's see why we bothered.

UTF-8 Encoding benchmarks: Before and after

To give context to this tool you need to review how hand rolled benchmarks often look. In this case I'll just revisit a benchmark I did for a previous post measuring different methods of encoding UTF-8 Strings into a byte buffer. The full code base is here but here's the original code used for benchmarking and comparing(written by Evan Jones):
This is quite typical, actually better than most benchmarking code as things go. But it's quite allot of code to basically compare a few ways of achieving the same thing. If you are going to do any amount of benchmarking you will soon grow tired of this boiler plate and come up with some framework or other... So how about you don't bother? Here's how the benchmark looks when Caliper-ized, including the code actually under test:
Note there's hardly any code concerned with the benchmarking functionality and the fact that for less lines of code we also fit in 3 flavours of the code we wanted to compare. Joy!

Running the main give you the following output:
Now, isn't that nice? you got this lovely little ASCII bar on the right, the results units are sorted. Yummy! Here's some command line options to play with:
--trials <n> : this will run several trials of your benchmark. Very important! you can't rely on a single measurement to make conclusions.
--debug : If you want to debug the process this will not spawn a new process to run your benchmark so that you can intercept the breakpoints easily.
--warmupMillis <millis> : how long to warm up your code for.
--runMillis <millis> : how long should a trial run take
--measureMemory : will measure and compare allocations
Isn't that great? sadly the last one (measureMemory) is a bit annoying to get working because:
  1. The dependency jar does not work
  2. Just getting the right jar is not enough because...
  3. You need to set up a magical environment variable: ALLOCATION_JAR
  4. Don't rename the allocation.jar the name is in the manifest and is required for the java agent to work.
Here's an Ant task which runs the UTF-8 benchmark with measureMemory:
And the output illustrates how using String.getBytes will cause allot of extra allocations compared to the other methods:
That took a bit of poking around the internet to sort out, but now you don't have to. And now that it's so easy to write micro benchmarks, there's less of an excuse to not measure before implementing a particular optimization.
Finally, to their eternal credit to writers of Caliper include a page on the project site which highlights some of the pitfalls and considerations around micro benchmarks, so please "Beware the Jabberwock" :P
Enjoy.

Sunday, 6 January 2013

Direct Memory Alignment in Java

Summary: First in a quick(hopefully) series of posts on memory alignment in Java. This post introduces memory alignment, shows how to get memory aligned blocks, and offers an experiment and some results concerning unaligned memory performance.

Since the first days of Java, one of the things you normally didn't need to worry about was memory. This was a good thing for all involved who cared little if some extra memory was used, where it was allocated and when will it be collected. It's one of the great things about Java really. On occasion however we do require a block of memory. A common cause for that is for doing IO, but more recently it has been used as a means to having off-heap memory which allows some great performance benefits to the right use case. Even more recently there has been talk of bringing back C-style structs to Java, to give programmers better control over memory layout. Having stayed away from direct memory manipulation for long(or having never had to deal with it) you may want to have a read of the most excellent series of articles "What Every Programmer Should Know About Memory" by Ulrich Drepper. I'll try and cover the required material as I go along.


Getting it straight

Memory alignment is mostly invisible to us when using Java, so you can be forgiven for scratching you head. Going back to basic definitions here:
"A memory address a, is said to be n-byte aligned when n is a power of two and a is a multiple of n bytes.
A memory access is said to be aligned when the datum being accessed is n bytes long and the datum address is n-byte aligned. When a memory access is not aligned, it is said to be misaligned. Note that by definition byte memory accesses are always aligned."
In other words for n  which is a power of 2:
boolean nAligned = (address%n) == 0;
Memory alignments of consequence are:
  1. Type alignment(1,2,4,8) - Certain CPUs require aligned access to memory and as such would get upset(atomicity loss) if you attempt misaligned access to your data. E.g. if you try to MOV a long to/from an address which is not 8-aligned.
  2. Cache line alignment(normally 64, can be 32/128/other) - The cache line is the atomic unit of transport between the main memory and the different CPU caches. As such packing relevant data to that alignment and to that punctuation can make a difference to your memory access performance. Other considerations are required here due to the rules of interaction between the CPU and the cache lines(false sharing, word tearing, atomicity)
  3. Page size alignment(normally 4096, can be configured by OS) - A page is the smallest chunk of memory transferable to an IO device. As such aligning your data to page size, and using the page size as your allocation unit can make a difference to interactions when writing to disk/network devices.
Memory allocated in the form of objects (anything produced by 'new') and primitives is always type aligned and I will not be looking much into it. If you want to know more about what the Java compiler make of you objects, this excellent blog post should help.
As the title suggests I am more concerned with direct memory alignment. There are several ways to get direct memory access in Java, they boil down to 2 methods:
  1. JNI libraries managing memory --> not worried about those for the moment
  2. Direct/MappedByteBuffer/Unsafe which are all the same thing really. The Unsafe class is at the bottom of this gang and is the key to official and semi-official access to memory in Java.
The memory allocated via Unsafe.allocatememory will be 8 byte aligned. Memory acquired via ByteBuffer.allocateDirect will ultimately go through the Unsafe.allocatememory but will differ in 2 important ways:

  1. ByteBuffer memory will be zero-ed out.
  2. Up until JDK6 direct byte buffers were page aligned at the cost of allocating an extra page of memory for every byte buffer allocated. If you allocated lots of direct byte buffers this got pretty expensive. People complained and as of JDK7 this is no longer the case. This means that direct ByteBuffer are now only 8 byte aligned.
  3. Less crucial, but convenient: memory allocated via ByteBuffer.allocateDirect is freed as part of the ByteBuffer object GC. This mechanism is only half comforting as it depends on the finalizer being called[UPDATE: things are a tad more complex than this, but this is not the topic of this post... DirectByteBuffer cleanup is done by a sun.misc.Cleaner, which is a PhatomRefeference to the buffer and will trigger deallocation when the PhantomReference is processed, see the code for more details], and that is not much to depend on.

Allocating an aligned ByteBuffer

No point beating about the bush, you'll find it's very similar to how page alignment works/used to work for ByteBuffers, here's the code:

To summarize the above, you allocate as much extra memory as the required alignment to ensure you can position a large enough memory slice in the middle of it.


Comparing Aligned/Unaligned access performance

Now that we can have an aligned block of memory to play with, lets test drive some theories. I've used Caliper as the benchmark framework for this post (it's great, I'll write a separate post on my experience/learning curve) [UPDATE: This post is from the dark pre-JMH days, these days you should NOT use Caliper, use JMH instead] and intend to convert previous experiments to use it when I have the time. The theories I wanted to test out in this post are:
Theorem I: Type aligned access provides better performance than unaligned access.
Theorem II: Memory access that spans 2 cache lines has far worse performance than aligned mid-cache line access.
Theorem III: Cache line access performance changes based on cache line location.
To test the above theorems I put together a small experiment/benchmark, with an algorithm as follows:
  1. Allocate a page aligned memory buffer of set sizes: 1,2,4,8,16,32,64,128.256,512,1024,2048 pages. Allocation time is not measured but done up front. The different sizes will highlight performance variance which stems from the cache hierarchy of sizes.
  2. We will write a single long per cache line (iterate through the whole memory block), then go back and read the written values (iterate through the whole memory block). There are usually 64 cache lines in a page (4096b/64b case), but we can only write 63 longs which will 'straddle' 2 lines, so the non-straddled offset will skip the first line to have the same number of operations.
  3. Repeat step 2 (2048/(size in pages)) times. The point is to do the same number of memory access operations per experiment.
Here is the code for the experiment:


Before moving on to the results please note that this test is very likely to yield different results on different hardware, so your mileage is very likely to vary. If you find the time to run the test on your own hardware I'd be very curious to compare notes. I used my laptop, which has an i5-2540M processor(Sandy Bridge, dual core, hyper threaded, 2.6Ghz). The L1 Cache is 32K, L2 is 256K and L3 is 3M. This is important in the context of the changes in behaviour we would expect to see as the data set exceeds the capacity of each cache. Should you run this experiment on a machine with different cache allocations, expect your results to vary in accordance.
This experiment is demonstrating a very simple use case(read/write long). There is no attempt to enjoy the many features the CPU offers which may indeed stronger alignment than simple reading and writing. As such take the results to be limited in scope to this use case alone.
Finally, note that the charts reflect relative performance to offset 0 memory access. As the performance varied also as a function of memory buffer size I felt this helps highlight the difference in behaviour which is related to offset rather than size. The effect of the size of the memory buffer is reflected in this chart, showing time as function of size for offset 0:
The chart shows how the performance is determined by the cache the memory buffer fits into. The caches size in pages is 8 for L1, 64 for L2, and 768 for L3 which correspond to the steps(200us, 400us, 600us) we see above, with a final step into main memory(1500us). While not the topic at hand it is worth noting the effect a reduced data set size can have on your application performance, and by extension the importance of realistic data sets in benchmarking.


Theorem I: Type aligned access provides better performance than unaligned access - NOT ESTABLISHED (for this particular use case)

To test Theorem I I set offset to values 0 to 7. Had a whirl and to my surprise found it made no bloody difference! I double and triple checked and still no difference. Here's a chart reflecting the relative cost of memory access:

What seems odd is the difference in performance for the first 4 byte, which are significantly less performant then the rest for memory buffer sizes which fit in the L1 cache(32k = 4k * 8 = 8 pages). The rest show relatively little variation and for the larger sizes there is hardly any difference at all. I have been unable to verify the source of the performance difference...
What is this about? Why would Mr. Drepper and many others on the good web lie to me? As it turns out Intel in their wisdom have sorted this little nugget out for us recently with Nehalem generation of CPUs, such that unaligned type access has no performance impact. This may not be the case on other non-Intel CPUs, or older Intel CPU. I ran the same experiment on my i5 laptop and my Core2 desktop, but could not see a significant difference. I have to confess I find this result a bit alarming given how it flies in the face of accepted good practice. A more careful read of Intel's Performance Optimization Guide reveals the recommendation to align your type stands, but it is not clear what adverse effects it may have for the simple use case we have here. I will attempt to construct a benchmark aimed at uncovering those issues in a further post perhaps. For now it may comfort you to know that breaking the alignment rule seems to not be the big issue it once was on x86 processors. Note that behaviour on non-x86 processors may be wildly different.


Theorem II: Memory access that spans 2 cache lines has far worse performance than aligned mid-cache line access - CONFIRMED

To test Theorem II I set the offset to 60. The result was a significant increase in the run time of the experiment. The difference was far more pronounced on the Core2 (x3-6 the cost of normal access) then on the i5 (roughly x1.5 the cost of normal access), and we can look forward to it being less significant as time goes by. This result should be of interest to anybody using direct memory access as the penalty is quite pronounced. Here's a graph comparing offset 0,32 and 60:

The other side effect of cache line straddling is loss of update atomicity, which is a concern for anyone attempting concurrent direct access to memory. I will go back to the concurrent aspects of aligned/unaligned access in a later post.


Theorem III: Cache line access performance changes based on cache line location - NOT ESTABLISHED

This one is based on Mr. Dreppers article:
3.5.2 Critical Word Load

Memory is transferred from the main memory into the caches in blocks which are smaller than the cache line size. Today 64 bits are transferred at once and the cache line size is 64 or 128 bytes. This means 8 or 16 transfers per cache line are needed.
The DRAM chips can transfer those 64-bit blocks in burst mode. This can fill the cache line without any further commands from the memory controller and the possibly associated delays. If the processor prefetches cache lines this is probably the best way to operate.
If a program's cache access of the data or instruction caches misses (that means, it is a compulsory cache miss, because the data is used for the first time, or a capacity cache miss, because the limited cache size requires eviction of the cache line) the situation is different. The word inside the cache line which is required for the program to continue might not be the first word in the cache line. Even in burst mode and with double data rate transfer the individual 64-bit blocks arrive at noticeably different times. Each block arrives 4 CPU cycles or more later than the previous one. If the word the program needs to continue is the eighth of the cache line, the program has to wait an additional 30 cycles or more after the first word arrives
To test Theorem III I set the offset values to the different type aligned locations on a cache line for a long: 0,8,16,24,32,40,48,56. My expectation here was to see slightly better performance for the 0 location as explained in Mr. Drepper's paper, with degrading performance as you get further from the begining of the cache line, at least for the large buffer sizes where data is always fetched from main memory. Here's the result:

The results surprised me. As long as the buffer fit in my L1 cache, writing/reading from the first 4 bytes was significantly more expensive than elsewhere on the line, as discussed in Theorem I, but the other locations did not have measurable differences in cost. I pinged Martin Thompson which pointed me at the Critical Word First feature/optimization explained here:
Critical word first takes advantage of the fact that the processor probably only wants a single word by signaling that it wants the missed word to appear first in the block.  We receive the first word in the block (the one we actually need) and pass it on immediately to the CPU which continues execution.  Again, the block continues to fill up in the "background".
I was unable to determine when exactly Intel introduced the feature to their CPU's, and I'm not sure which processors fail to supply it.

Conclusions/Takeaways

Of the 3 concerns stated, only cache line straddling proved to be a significant performance consideration. Cache line straddling impact is diminishing in later Intel processors, but is unlikely to disappear altogether. As such it should feature in the design of any direct memory access implementation and may be of interest to serializing/de-serializing code.
The other significant factor is memory buffer size, which is obvious when one considers the cache hierarchy. This should prompt us to make an effort towards more compact memory structures. In light of the negligible cost of type mis-alignment we may want to skip type alignment driven padding of structures when implementing off-heap memory stores.
Finally, this made me realize just how fast moving is the pace of development in hardware which invalidates past conventional wisdom/assumptions. So yet another piece of evidence validating the call to 'Measure, Measure, Measure' all things performance.

Running the benchmarks yourself

  1. Code is on GitHub
  2. Run 'ant run-unaligned-experiments'
  3. Wait... it takes a while to finish
  4. Send me the output?
To get the most deterministic results you should run the experiments pinned to a core which runs nothing else, that would reduce noise from other processes 'polluting' the cache.

Many thanks to Martin, Aleksey Shipilev and Darach Ennis for proof reading and providing feedback on initial drafts, any errors found are completely their fault :-).

[UPADTE 22/06/2015: Experiments were repeated in JMH form, arriving at similar conclusions with great insight and cross platform testing by Aleksey Shipilev.]

Second part is here: Alignment, Concurrency and Torture

Thursday, 20 December 2012

Java ping: a performance baseline utility

Summary: an open source mini utility for establishing a baseline measurement of Java application TCP latency, a short discussion on the value of baseline performance measurements, and a handful of measurements taken using the utility.

We all know and love ping, and in most environments it's available for us as a means of testing the basic TCP network latency between machines. This is extremely useful, but ping is not written in Java and it's also not written with low latency in mind. This is important (or at least I think it is) when examining a Java application and trying to make an informed judgement on observed messaging latency in a given environment/setup.
I'll start with the code and bore you with the philosophy later:


The mechanics should be familiar to anyone who used NIO before, the notable difference from common practice is using NIO non-blocking channels to perform essentially blocking network operations.
The code was heavily 'inspired' by Peter Lawrey's socket performance analysis post and code samples (according to Mr. Lawrey's licence you may have to buy him a pint if you find it useful, I certainly owe him one). I tweaked the implementation to make the client spin as well as the server which improved the latency a bit further. I separated the client and server, added an Ant build to package them with some scripts and so on. Notes:
  • The server has to be running before the client connects and will shut down when the client disconnects. 
  • Both server and client will eat up a CPU as they both spin in wait for data on the socket channel. 
  • To get the best results pin the process to a core (as per the scripts).


Baseline performance as a useful measure

When measuring performance we often compare the performance of one product to the next. This is especially true when comparing higher level abstraction products which are supposed to remove us from the pain of networking, IO or other such ordinary and 'technical' tasks. It is important however to remember that abstraction comes at a premium, and having a baseline measure for your use case case help determine the premium. To offer a lame metaphor this is not unlike considering the bill of material in the bottom line presented to you by your builder.
While this is not a full blown application, it illustrates the cost/latency inherent in doing TCP networking in Java. Any other cost involved in your application request/response latency needs justifying. It is reasonable to make all sort of compromises when developing software, and indeed there are many a corner to be cut in a 50 line sample that simply would not do in a full blown server application, but the 50 line sample tells us something about the inherent cost. Some of the overhead you may find acceptable for your use case, other times it may not seem acceptable, but having a baseline informs you on the premium.
  • On the same stack(hardware/JDK/OS) your application will be slower then your baseline measurement, unless it does nothing at all.
  • If you are using any type of framework, compare the bare bones baseline with your framework baseline to find the basic overhead of the framework (you can use the above to compare with Netty/MINA for instance).
  • Consider the hardware level functionality of your software to match with baseline performance figures (i.e: sending messages == socket IO, logging == disk IO etc.). If you think a logging framework has little overhead on top of the cost of serializing a byte buffer to disk, think again.

Variety is the spice of life

To demonstrate how one would use this little tool I took it for a ride:
  • All numbers are in nanoseconds
  • Tests were run pinned to CPUs, I checked the variation between running on same core, across cores and across sockets
  • This is RTT(round trip time), not one hop latency(which is RTT/2)
  • The code prints out a histogram summary of pinging a 32b message. Mean is the average, 50% means 50% of updates had a latency below X, 99%/99.99% in the same vain. (percentiles are commonly used to measure latency SLAs)
To start off I ran it on my laptop(i5/Ubuntu 12.04/JDK7) on loopback, the result was:
Same core:   mean=8644.23, 50%=9000, 99%=16000, 99.99%=24000
Cross cores: mean=5809.40, 50%=6000, 99%=9000, 99.99%=23000
Sending and receiving data over loopback is CPU intensive, which is why putting the client and the server on the same core is not a good idea. I went on to run the same on a beefy test environment, which has 2 test machines with tons of power to spare, and a choice of NICs connecting them together directly. The test machine is a dual socket beast so I took the opportunity to run on loopback across sockets:
Cross sockets:           mean=12393.97, 50%=13000, 99%=16000, 99.99%=29000
Same socket, same core:  mean=11976.68, 50%=12000, 99%=16000, 99.99%=28000
Same socket, cross core: mean=7663.82, 50%=8000, 99%=11000, 99.99%=23000
Testing the connectivity across the network between the 2 machines I compared 2 different 10Gb card and a 1Gb card available on that setup, I won't mention make and model as this is not a vendor shootout:
10Gb A:  mean=19746.08, 50%=18000, 99%=26000, 99.99%=38000
10Gb B:  mean=30099.29, 50%=30000, 99%=33000, 99.99%=44000
1Gb  C:  mean=83022.32, 50%=83000, 99%=87000, 99.99%=95000
The above variations in performance are probably familiar to those who do any amount of benchmarking, but may come as a slight shock to those who don't. This is exactly what people mean when they say your mileage may vary :). And this is without checking for further variation by JDK version/vendor, OS etc. There will be variation in the performance depending on all these factors which is why a baseline figure taken from your own environment can provide a useful estimation tool to performance on the same hardware. The above also demonstrates the importance of process affinity when considering latency.


Conclusion

An average RTT latency of 20 microseconds between machines is pretty nice. You can do better by employing better hardware and drivers(kernel bypass), and you can make your outliers disappear by fine tuning JVM options and the OS. At it's core Java networking is pretty darn quick, make sure you squeeze all you can out it. But to do that, you'll need a baseline figure to let you know when you can stop squeezing, and when there's room for improvement.
UPDATE(4/07/2014): I forgot to link this post to it's next chapter where we explore the relative performance of different flavours of the same benchmark using select()/selectNow()/blocking channels/memory mapped files as the ping transport, all nicely packaged for you to play with ;-).

Thursday, 13 December 2012

Atomic*.lazySet is a performance win for single writers

Summary: For programs respecting the Single Writer principle the Atomic*.lazySet method and it's underlying Unsafe.putOrdered* intrinsic present a performance win in the form of significantly cheaper volatile writes.
[UPDATE 20/12/2016: here's a more recent definition and references on what lzySet/putOrdered is]
A few months ago I attended Martin Thompson's excellent Lock Free Algorithms course, the course walks through some familiar territory for those who have been reading his blog and read through the disruptor, and lots of other goodies which are not. Most of all, the dude himself is both amazingly knowledgeable on all things concurrent, and a clear presenter/teacher on a topic that is confusing and often misunderstood. One of the facilities we utilized during that course, and one that is present under the covers of the disruptor, was lazySet/putOrdered. It was only after the course that I wondered what is that bit of magic and how/why it works. Having talked it over with Martin shortly, and having dug up the treasures of the internet I thought I'd share my findings to highlight the utility of this method.

The origins of lazySet

"In the beginning there was Doug"

And Doug said: "This is a niche method that is sometimes useful when fine-tuning code using non-blocking data structures. The semantics are that the write is guaranteed not to be re-ordered with any previous write, but may be reordered with subsequent operations (or equivalently, might not be visible to other threads) until some other volatile write or synchronizing action occurs)." - Doug Lea is one of the main people behind Java concurrency and the JMM and the man behind the java.util.concurrent package. Carefully reading his definition of lazySet it is not clear that it guarantees much at all of and by itself.
The description of where it might prove useful is also not that encouraging: "The main use case is for nulling out fields of nodes in non-blocking data structures solely for the sake of avoiding long-term garbage retention" - Which implies that if the implementers of lazySet are free to delay the set indefinitely. Nulling out values you don't care about particularly in terms of visibility does not sound like such a hot feature.
The good bit is however saved for last: "lazySet provides a preceeding store-store barrier (which is either a no-op or very cheap on current platforms), but no store-load barrier" - Lets refresh our memory from Doug's cookbook(no muffins there :-(, but lots of crunchy nuggets of wisdom):
StoreStore Barriers: The sequence: Store1; StoreStore; Store2 ensures that Store1's data are visible to other processors (i.e.,flushed to memory) before the data associated with Store2 and all subsequent store instructions. In general, StoreStore barriers are needed on processors that do not otherwise guarantee strict ordering of flushes from write buffers and/or caches to other processors or main memory.

StoreLoad Barriers: The sequence: Store1; StoreLoad; Load2 ensures that Store1's data are made visible to other processors (i.e., flushed to main memory) before data accessed by Load2 and all subsequent load instructions are loaded. StoreLoad barriers protect against a subsequent load incorrectly using Store1's data value rather than that from a more recent store to the same location performed by a different processor. Because of this, on the processors discussed below, a StoreLoad is strictly necessary only for separating stores from subsequent loads of the same location(s) as were stored before the barrier. StoreLoad barriers are needed on nearly all recent multiprocessors, and are usually the most expensive kind. Part of the reason they are expensive is that they must disable mechanisms that ordinarily bypass cache to satisfy loads from write-buffers. This might be implemented by letting the buffer fully flush, among other possible stalls.
We all like cheap(love no-op) and hate expensive when it comes to performance, so we would all like lazySet to be as good as a volatile set, just allot cheaper. A volatile set would require a StoreLoad barrier, which is expensive because it has to make the data available to everyone before we get on with our tasks, and get the latest data in case someone else changed it. This is implicit in the line "protect against a subsequent load incorrectly using Store1's data value rather than that from a more recent store to the same location". But if there is only a single writer we don't need to do that, as we know no one will ever change the data but us.
And from that follows that strictly speaking lazySet is at the very least as correct as a volatile set for a single writer.
At this point the question is when (if at all) will the value set be made visible to other threads.

"Dear Doug"

The Concurrency Interest is an excellent source of informal Q&A with the Java concurrency community and the question I ask above has been answered there by the Doug:
1) Will lazySet write actually happens in some finite time?
The most you can say from the spec is that it will be written no later than at the point that the process must write anything else in the Synchronization Order, if such a point exists. However, independently of the spec, we know that so long as any process makes progress, only a finite number of writes can be delayed. So, yes.
2) If it happens (== we see spin-wait loop finished) -- does it mean,that all writes preceeding lazySet are also done, commited, and visible to thread 2, which finished spin-wait loop?
Yes, although technically, you cannot show this by reference to the Synchronization Order in the current JLS.
...
lazySet basically has the properties of a TSO store
To give credit where credit is due, the man who asked the question is Ruslan Cheremin and if you can read Russian, or what google translate makes of it you can see he was similarly curious about the guarantees provided by lazySet and his inquiry and the bread crumbs it left made my job much easier.
Now that we've established lazySet definitely should work, and that Doug promises us an almost free volatile write for single writers, all we need to quantify is how lazy is lazySet exactly. In Doug's reply he suggests the publication is conditional on further writes being made somehow causing the CPU to flush the store queue at some unknown point in the future. This is not good news if we care about predictable latency.

Lazy, Set, Go!

To demonstrate that lazySet is in fact fine in terms of latency, and to further demonstrate that it is a big win for single writers I put together some experiments. I wanted to demonstrate the low level mechanics behind lock free wait free(no sychronized blocks/locks/wait/notify allowed) inter-thread communications and to do so I re-implemented/trimmed to size AtomicLong as a VolatileLong because we don't need the atomicity offered on set and I also wanted to add a direct(as in not ordered or volatile) setter of the value(the full code is here):
I hid the actual choice of setter by creating a Counter interface with a get and set method. The get always used the volatile getter, as using the direct one results in the values never being propagated. It's included for completeness. The experiments were run with same core and cross core affinity. 

Ping Pong - demonstrate lazySet has good latency charecteristics

We have 2 threads who need to keep pace with each other such that one informs the other of it's current long value, and waits for the other to confirm he got it before incrementing that same value and repeating. In the real world there is a better(as in faster) way to implement this particular requirement of keeping 2 threads in step, but as we are looking at single writers we will make a counter for each thread and maintain the single writer principle. The full code is here, but the core is:
Note that this is a rather contrived behaviour in a lock free wait free program as the threads spin wait on each other, but as a way of measuring latency it works. It also demonstrates that even though no further writes are made after lazySet the value still 'escapes' as required.

Catchup - demonstrate lazySet cost for single writer


One thread is using a counter to mark inserted values into an array. The other thread is reading the value of this counter and scans through the array until it catches up with the counter. This is a typical producer consumer relationship and the low cost of our lazy write is supposed to shine here by not imposing the cost of a full store-load instruction on the writing thread. Note that in this experiment there is no return call from the consumer to the producer. The full code is here, but the core is:

Results and analysis


Sorry for the slightly lame chart, I'll explain:
  • Labels go Experiment -> set method -> affinity, i.e Catchup direct same means it's the result for running the catchup experiment using direct set with affinity set up such that both threads are running on the same core.
  • Yellow bar is maximum run time, orange is median, blue is minimum.
As we can see for the Ping Pong experiment there is practically no difference between the different methods of writing. Latency is fairly stable although volatile performs slightly better in that respect. The Catchup experiment demonstrates the fact that volatile writes are indeed significantly more expensive(5-6 times) then the alternatives.
The curious guest at this party is the direct write. It shouldn't really work at all, and yet not only does it work it also seems like a better performer than lazySet/putOrdered, how come? I'm not sure. It certainly isn't a recommended path to follow, and I have had variations of the experiments hang when using the direct set. The risk here is that we are completely at the mercy of the JIT compiler cleverness not realizing that our set can legally be done to a register rather than a memory location. We also have no guarantees regarding re-ordering, so using it as a write marker as done in catchup is quite likely to break in more complex environments or under closer inspection. It may be worth while using when no happens before guarantee is required for prior writes i.e. for publishing thread metrics or other such independent values, but it is an optimization that might backfire at any time.

Summary:

The lazySet/putOrdered as a means of providing a happens before edge to memory writes is one of the building blocks of the Disruptor and other frameworks. It is a useful and legitimate method of publication and can provide measurable performance improvements as demonstrated.

Further thoughts on related topics...

As part of the data collection for this article I also looked at padded variations of the volatile long used to defend against false sharing and implemented a few variations of those. I went on to implement the same padded and un-padded variations as off heap structures and compared the performance of each, hitting some interesting issues along the way. In the end I decided it is best to keep this post focused and put the next step along into another post, the code is however available for reading on Github and should you find it interesting I'm happy to discuss.

References:

Wednesday, 5 December 2012

Experimentation Notes: on herding processes and CPUs

Summary: notes on cpu affinity and c-state management from recent benchmarking efforts.
Your OS assumes your machine is used for a mix of activities, all of which have the same priority roughly and all must stand in line to get at limited resources. This is mostly terrific and lets us multi-task to our inner ADHD child's content. There are times however when you might want to exercise some control over who goes where and uses what, here's some notes to assist on this task. This is not a proper way to do this(it will all go away on restart for one), I'm not much of a UNIX guru, this is rather an informal cheat sheet to help you get where you are going.

IRQ Balance

Stop the OS from sending interrupts fairly:
service irqbalance stop

CPU power saving - cpufreq

Your OS is trying to be green and put your CPUs to sleep when it thinks you are not using them. Good for some but not when you are in a hurry: 
echo performance | sudo tee /sys/devices/system/cpu/cpu*/cpufreq/scaling_governor
When you are done set it back to scaling the frequency on demand:
echo ondemand | sudo tee /sys/devices/system/cpu/cpu*/cpufreq/scaling_governor

Pin processes to CPU cores

To put all you processes on a particular cpu mask(0 in this example):
for i in `ps -eo pid` ; do sudo taskset -pc 0 $i ; done
When you are done you can let them roam again:
for i in `ps -eo pid` ; do sudo taskset -pc 0-3 $i ; done
This is useful when benchmarking, everybody moves to one core and you taskset your benchmarking process onto the cores left. Note that some processes may refuse to move. If you are in a NUMA environment you might have to use numactl instead.

Monday, 3 December 2012

Encode UTF-8 String to a ByteBuffer - faster

Summary: By utilizing Unsafe to gain access to String/CharBuffer/ByteBuffer internals and writing a specialized UTF-8 encoder we can get a significant(> 30%) performance gain over traditional methods and maintain that advantage for both heap and direct buffers across different JDK versions.

"Not all who wonder are lost"

Not so recently I've been looking at this code that de-serializes messages through a profiler and a hotspot came up around the decoding/encoding of UTF8 strings. Certainly, I thought to myself, this is all sorted by some clever people somewhere, had a look around and found lots of answers but not much to keep me happy. What's the big deal you wonder:
  1. UTF8 is a clever little encoding, read up on what it is on Wikipedia. Not as simple as those lovely ASCII strings and thus far more expensive to encode/decode. The problem is that Strings are backed by char arrays, which in turn can only be converted back and forth to bytes using encodings. A UTF8 char can be encoded to 1-4 bytes. The Strings also do not have a length in bytes, and are often serialized without that handy piece of information being available, so it's a case of finding how many bytes you need as you go along (see the end result implementation for a step by step).
  2. Java Strings are immutable and defensive, if you give them chars they copy it, if you ask for the chars contained they get copied too.
  3. There are many ways to skin the encoding/decoding cat in Java that are considered standard. In particular there are variations around the use of Strings, Charsets, arrays and Char/Byte buffers (more on that to come).
  4. Most of the claims/samples I could find were not backed by a set of repeatable experiments, so I struggled to see how the authors arrived at the conclusions they did.

"Looking? Found someone you have!"

After much looking around I've stumbled upon this wonderful dude at MIT Evan Jones and his excellent set of experiments on this topic Java String Encoding and his further post on the implementation behind the scenes. Code is now on GitHub(you'll find it on his blog in the form of a zip, but I wanted to fork/branch from it): https://github.com/nitsanw/javanetperf and a branch with my code changes is under https://github.com/nitsanw/javanetperf/tree/psylobsaw

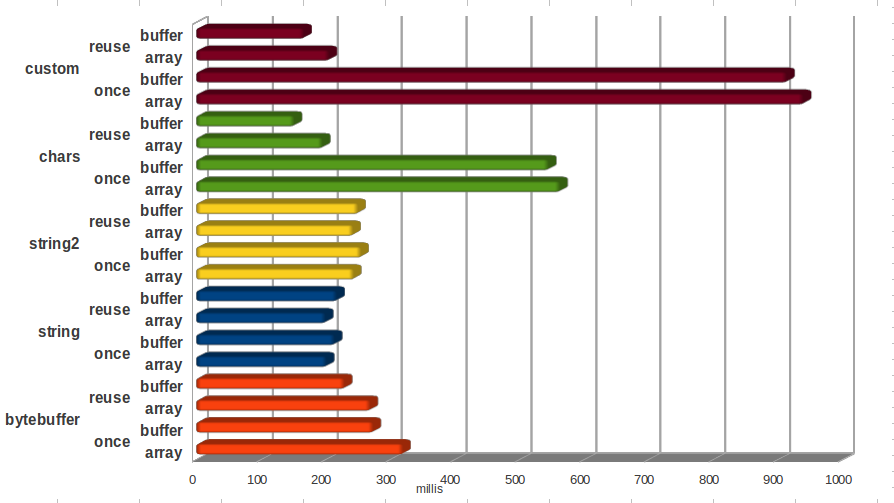
Having downloaded this exemplary bit of exploratory code I had a read and ran it (requires python). When I run the benchmarks included in the zip file on my laptop I get the following results(unit of measurement has been changed to millis, upped the test iterations to 1000 etc. The implementation is the same, I was mainly trying to get stable results):

* The above was run using JDK 1.6.37 on Ubuntu 12.04(64bit) on with an i5-2540M CPU @ 2.60GHz × 4.
I find the names a bit confusing, but Mr. Jones must have had his reasons. In any case here's what they mean:
  • bytebuffer - uses a CharBuffer.wrap(String input) as the input source to an encoder.
  • string - uses String.getBytes("UTF-8")
  • chars - copies the string chars out by using String.getChars, the chars are the backing array for a CharBuffer then used as the input source to an encoder.
  • custom - steals the char array out of String by using reflection and then wrapping the array with a CharBuffer.
  • once/reuse - refers to the encoder object and it's bits, weather a new once was created per String or the same reused.
  • array/buffer - refers to the destination of the encoding a byte array or a ByteBuffer.
The story the above results tell is quite interesting, so before I dive into my specialized case, here's how I read them:
  • There are indeed many flavours for this trick, and they vary significantly in performance.
  • The straight forward, simplest way i.e. using String.getBytes() is actually not bad when compared to some of the other variations. This is quite comforting on the one hand, on the other hand it highlights the importance of measuring performance 'improvements'. 
  • The best implementation requires caching and reusing all the working elements for the task, something which happens under the hood in String for you. String also caches them in thread local variables, so in fact gives you thread safety on top of what other encoding implementations offer.
  • Stealing the char array using reflection is more expensive then copying them out. Teaching us that crime does not pay in that particular case.
One oddity I stumbled on while researching the topic was the fact that using String.getBytes(Charset) is actually slower then using the Charset name. I added that case as string2 in the chart above. This is due to the getBytes(String) implementation re-using the same encoder(as long as you keep asking for the same charset) while the one using the Charset object is creating a new encoder every time. Rather counter intuitive as you'd assume the Charset object would spare String.getBytes the need to look it up by the charset name. I read that as the JDK developers optimizing for the most common case to benefit the most users, leaving the less used path worse off. But the lesson here is again to measure, not assume.

"Focus!"

The use case I was optimizing for was fairly limited, I needed to write a String into a ByteBuffer. I knew a better way to steal the char array, as discussed in a previous post, using Unsafe(called that one unsafe). Also, if I was willing to tempt fate by re-writing final fields I could avoid wrapping the char array with a new CharBuffer(called that one unsafe2). I also realized that calling encoder.flush() was redundant for UTF-8 so trimmed that away(for both unsafe implementations, also did the same for chars and renamed chars2). Re-ran and got the following results, the chart focuses on the use case and adds relevant experiments:


We got a nice 10% improvement there for stealing the char[] and another 5% for re-writing a final field. Not to be sneezed at, but not that ground breaking either. It's worth noting that this is 10-15% saved purely by skipping a memory copy and the CharBuffer wrap, which tells us something about the cost of memory allocations when compared to raw computation cycles.
To further improve on the above I had to dig deeper into the encoder (which is where unsafe3 at above comes into play)  implementation which uncovered good news and bad news.

"The road divides"

The bad news were an unpleasant little kink in the works. As it turns out string encoding can go down 2 different paths, one implementation is array based for heap ByteBuffers(on heap, backed by arrays), the other works through the ByteBuffer methods(so each get/set does explicit boundary checks) and will be the chosen path if one of the buffers is direct (off heap buffers). In my case the CharBuffer is guaranteed to be heap, but it would be quite desirable for the ByteBuffer to be direct. The difference in performance when using a direct ByteBuffer is quite remarkable, and in fact the results suggest you are better off using string and copying the bytes into the direct buffer. But wait, there's more.

"And then there were three"

The good news were that the topic of String encoding has not been neglected and that it is in fact improving from JDK version to JDK version. I re-run the test for JDK5, 6 and 7 with heap and direct buffers. I won't bore you with the losers of this race, so going forward we will look only at string, chars2, and the mystery unsafe3. The results for heap buffers:
Heap buffer encoding results
The results for direct buffers(note the millis axis scale difference):
Direct buffer encoding results
What can we learn from the above?
  • JDK string encoding performance has improved dramatically for the getBytes() users. So much in fact that it renders previous best practice less relevant. The main benefit of going down the Charset encode route is the memory churn reduction.
  • The improvement for the unsafe implementation suggests there were quite a few underlying improvements in the JIT compiler for in-lining intrinsics.
  • Speed has increased across the board for all implementations, joy for all.
  • If you are providing a framework or a library you expect people to use with different JDKs and you need to provide comparable performance you need to be aware of underlying implementation changes and their implications. It might make sense to back port bit of the new JDK and add them to your jar as a means of bringing the same goods to users of old JDKs. This sort of policy is fairly common with regards to the concurrent collections and utilities.
 And now to unsafe3...

"Use the Source Luke"

At some point I accepted that to go faster I will have to roll up my sleeves and write an encoder myself(have a look at the code here). I took inspiration from a Mark Twain quote: "The kernel, the soul — let us go further and say the substance, the bulk, the actual and valuable material of all human utterances — is plagiarism.". No shame in stealing from your betters, so I looked at how I could specialize the JDK code to my own use case:
  •  I was looking at encoding short strings, and knew the buffers had to be larger then the strings, or else bad things happen. As such I could live with changing the interface of the encoding such that when it fails to fit the string in the buffer it returns overflow and you are at the same position you started. This means encoding is a one shot operation, no more encoding loop picking the task up where they left it.
  • I used Unsafe to pick the address out of the byte buffer object and then use it to directly put bytes into memory. In this case I had to keep the boundary checks in, but it still out performed the heap one in JDK7, so maybe the boundary checks are not such a hindrance. I ran out of time with this, so feel free to experiment and let me know.
  • I tweaked the use of types and the constants and so on until it went this fast. It's fiddly work and you must do it with an experiment to back up your theory. At least from my experience a gut feeling is really not sufficient when tuning your code for performance. I would encourage anyone with interest to have a go at changing it back and forth to the JDKs implementation and figuring out the cost benefit of each difference. If you can further tune it please let me know.
  • Although not explicitly measured throughout this experiment there is a benefit in using the unsafe3 method(or something similar) in reducing the memory churn involved in the implementation. The encoder is very light weight and ignoring it's own memory cost involves no further memory allocation or copying in the encoding process. This is certainly not the case for either the chars2 solution or the string one and the overhead is proportional to the encoded string length.
  • This same approach can be used to create an encoder that would conform to the JDK interface. I'm not sure what the end result would perform like, but if you need to conform to the JDK interface there's still a win to be had here.
  • The direct buffer results suggest it might be possible to further improve the heap buffer result by using unsafe to put the byte in rather than array access. If that is the case then it's an interesting result of and by itself. Will be returning to that one in future.

And there you have it, a way to encode strings into byte buffers that is at least 30% faster then the JDK provided ones(for now) which gives you consistent performance across JDK versions and for heap and direct buffers :)

References: